Energy Storage · 2026-08-10
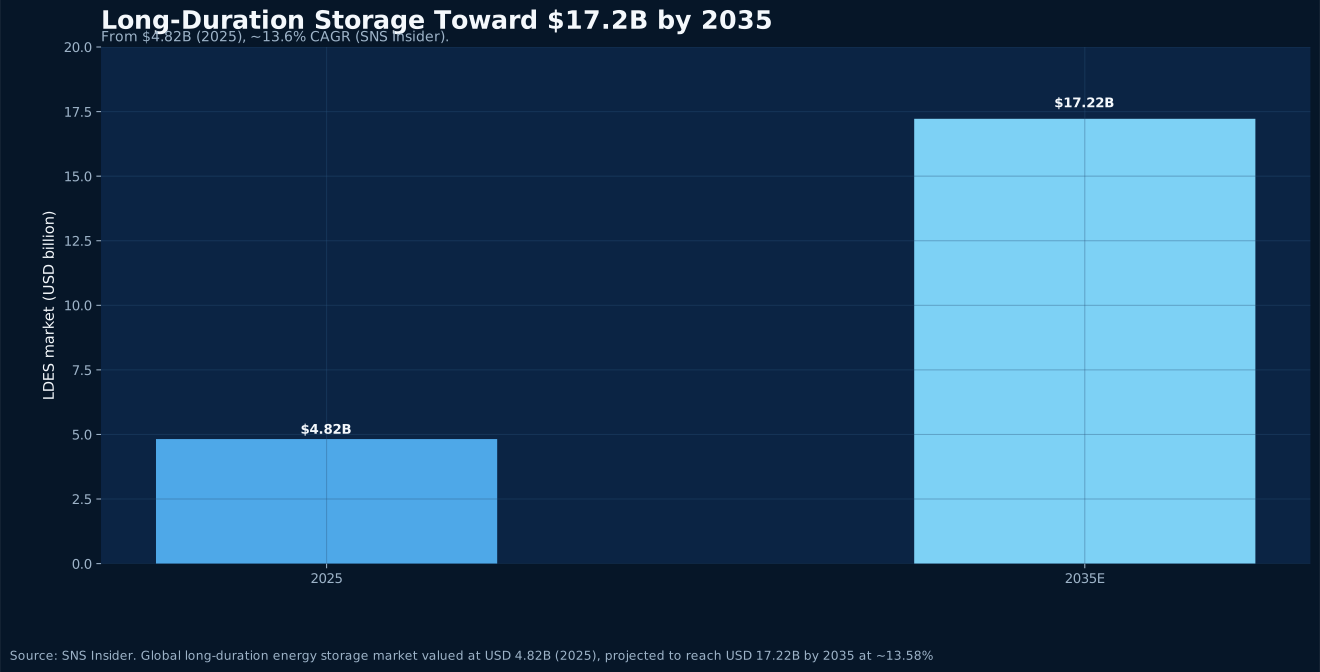
As wind and solar become the grid's backbone, storing surplus daytime and windy-hour power for the night and calm spells has become a key bottleneck. Per SNS Insider, the global long-duration energy storage market will grow from $4.82B (2025) to $17.22B (2035) at ~13.6% CAGR. Meanwhile, Form Energy's iron-air batteries have landed a 12 GWh deal with Crusoe for AI data centers — LDES is moving from policy concept to real orders.
Read Article
Fintech · 2026-07-13
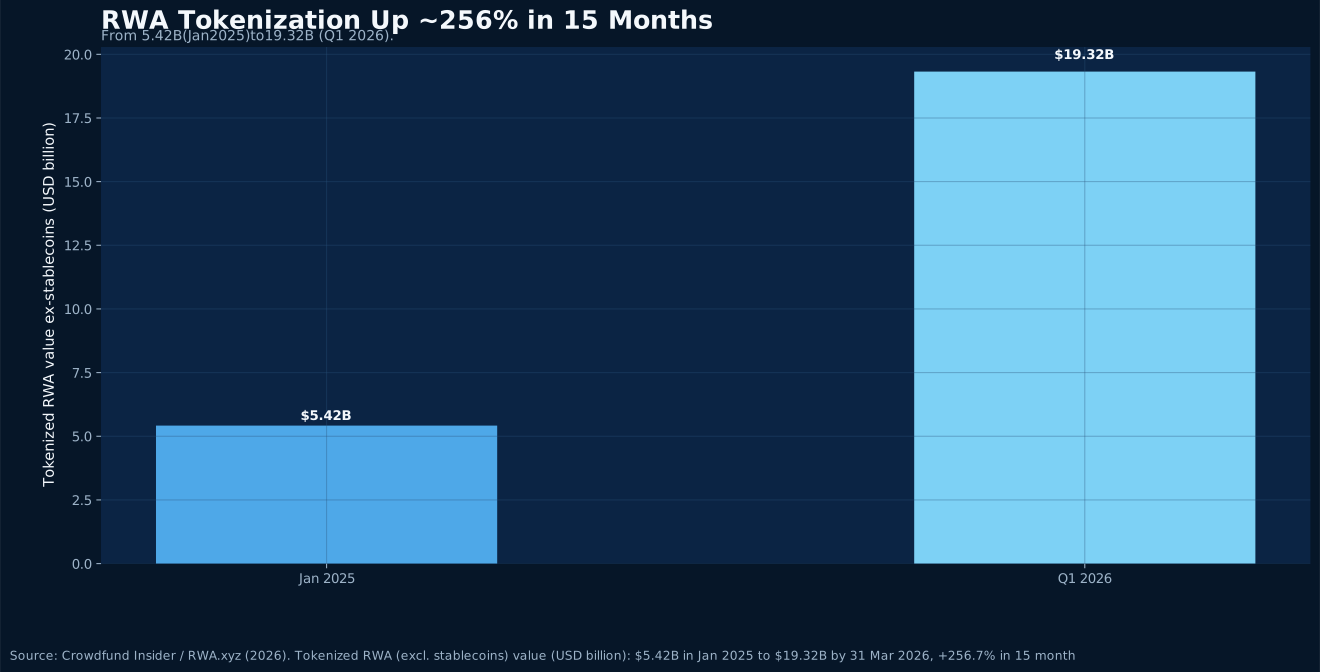
In 2026, on-chain finance is seeing two storylines surge in parallel. Total stablecoin market cap set an all-time high of about $320B in May, with supply holding above $313B and holders topping 241 million; Tether (USDT) accounts for ~$184.7B (~59%) and USDC ~$73.8B (~24%). Meanwhile, tokenized real-world assets (RWA) excluding stablecoins jumped from $5.42B in January 2025 to $19.32B by the first quarter of 2026, up about 256.7% in fifteen months. On-chain dollars and real assets are becoming twin engines, migrating traditional finance's balance sheet onto the blockchain. For cross-border trade and settlement, it signals a faster, more transparent, programmable money rail taking shape.
Read Article
Space Economy · 2026-07-13
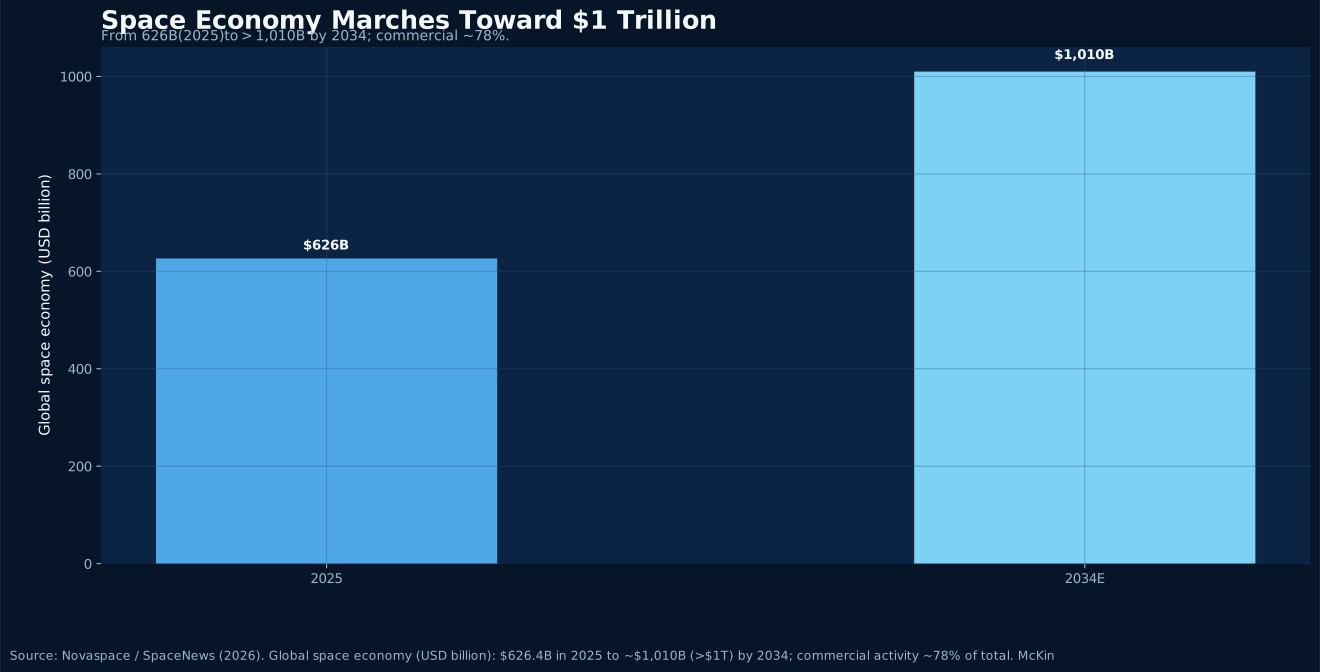
The space economy is crossing a historic threshold. Per Novaspace, the global space economy reached $626.4B in 2025 and is expected to top $1 trillion by 2034; commercial activity has risen to about 78% of the total, the main growth engine. The launch surge is just as striking: in 2025 global orbital launch attempts hit a record 324, more than double the pace of five years ago—of which SpaceX alone flew 165+ Falcon 9 missions, over 60% of global launches, reusing individual boosters 20+ times. Reusable rockets have pressed orbital cost to historic lows, turning 'access to space' from a state-only capability into a commercial service you can buy at scale. For satellite, comms, remote-sensing and cross-border logistics clients, space is shifting from a distant concept to usable infrastructure.
Read Article
Biotechnology · 2026-07-06
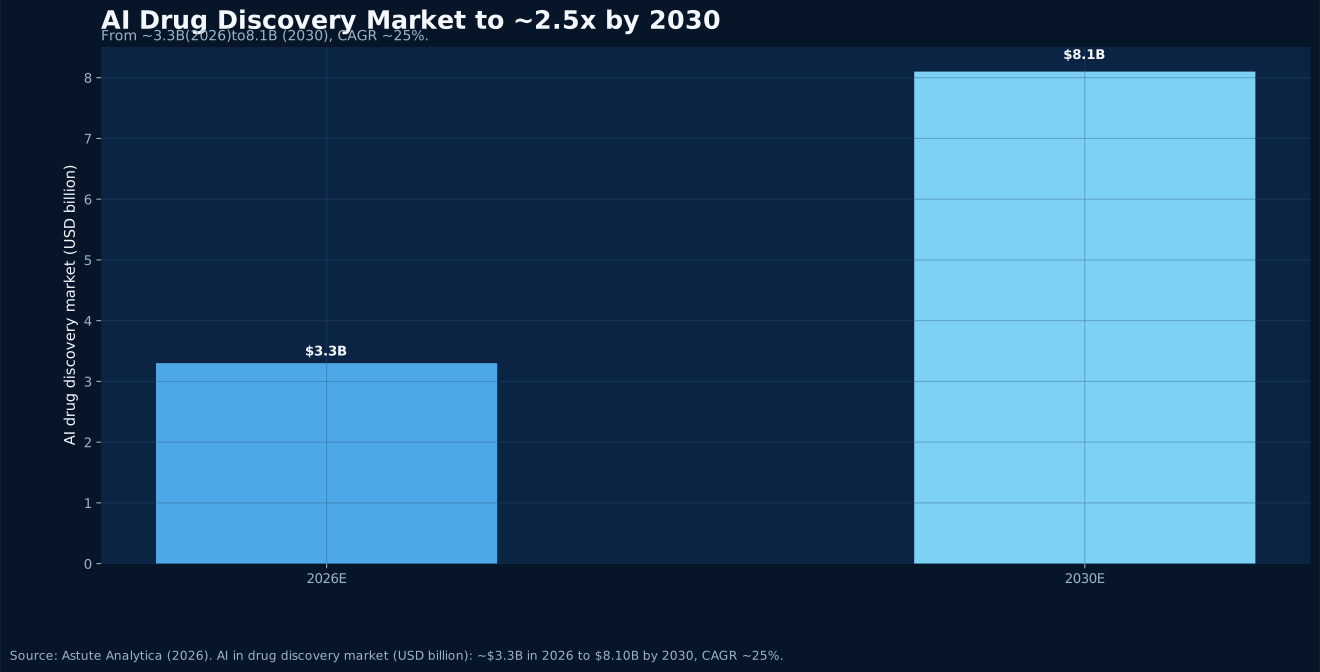
AI drug discovery is crossing from proving 'can it design a molecule' into testing 'can it actually work in the clinic.' Astute Analytica expects the global AI drug discovery market to grow from about $3.3B in 2026 to roughly $8.1B by 2030, a CAGR of about 25%. The pipeline matters more: 200+ AI-discovered drugs are now in clinical trials, ~175 AI-originated programs have entered human trials, and 15-20 are expected to reach pivotal Phase III in 2026. Yet as of mid-2026, no fully AI-designed drug has won FDA approval. For biopharma and cross-border health-industry clients, 2026 will be the watershed year that decides AI drug discovery's true worth.
Read Article
AI Infrastructure · 2026-06-07
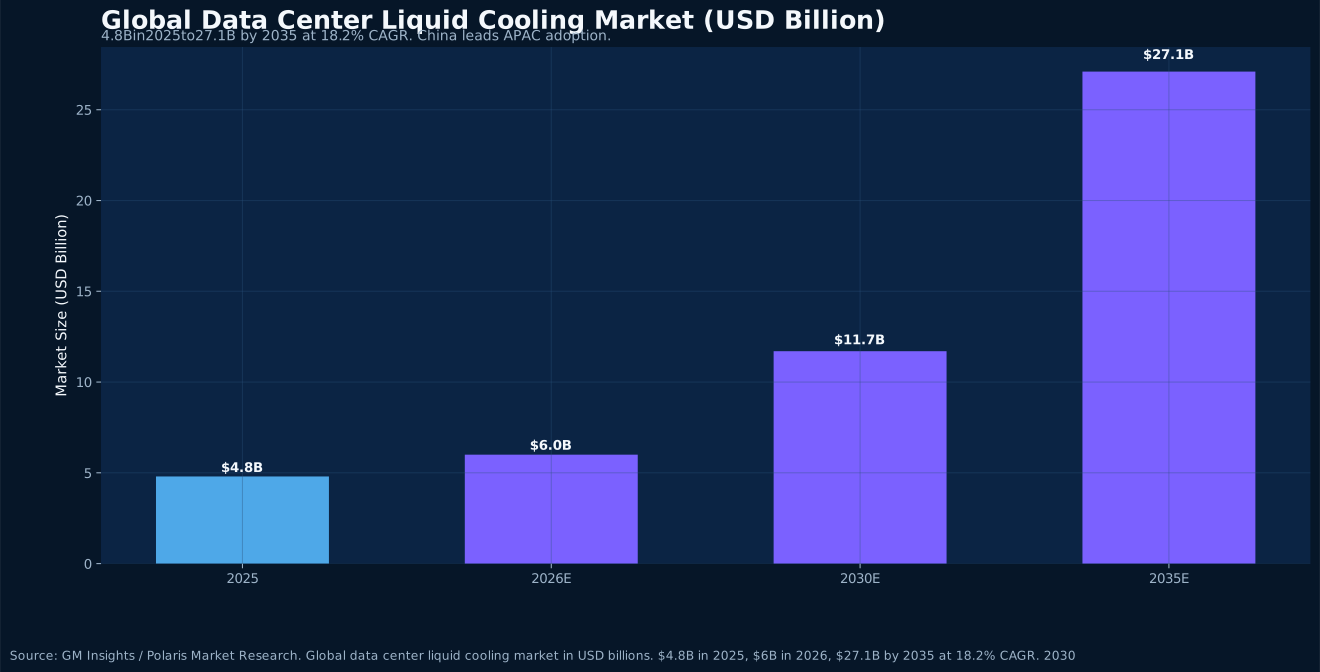
Surging AI-server power density is reshaping data-center cooling. The global data-center liquid-cooling market is forecast to grow from $4.8B in 2025 to $6B in 2026 and $27.1B by 2035, an 18.2% CAGR. With a strict PUE ≤1.3 policy and large-scale deployments by Alibaba, Tencent, ByteDance and Huawei, China leads APAC liquid-cooling adoption, opening growth space for related equipment and materials trade.
Read Article
Smart Manufacturing · 2026-05-25
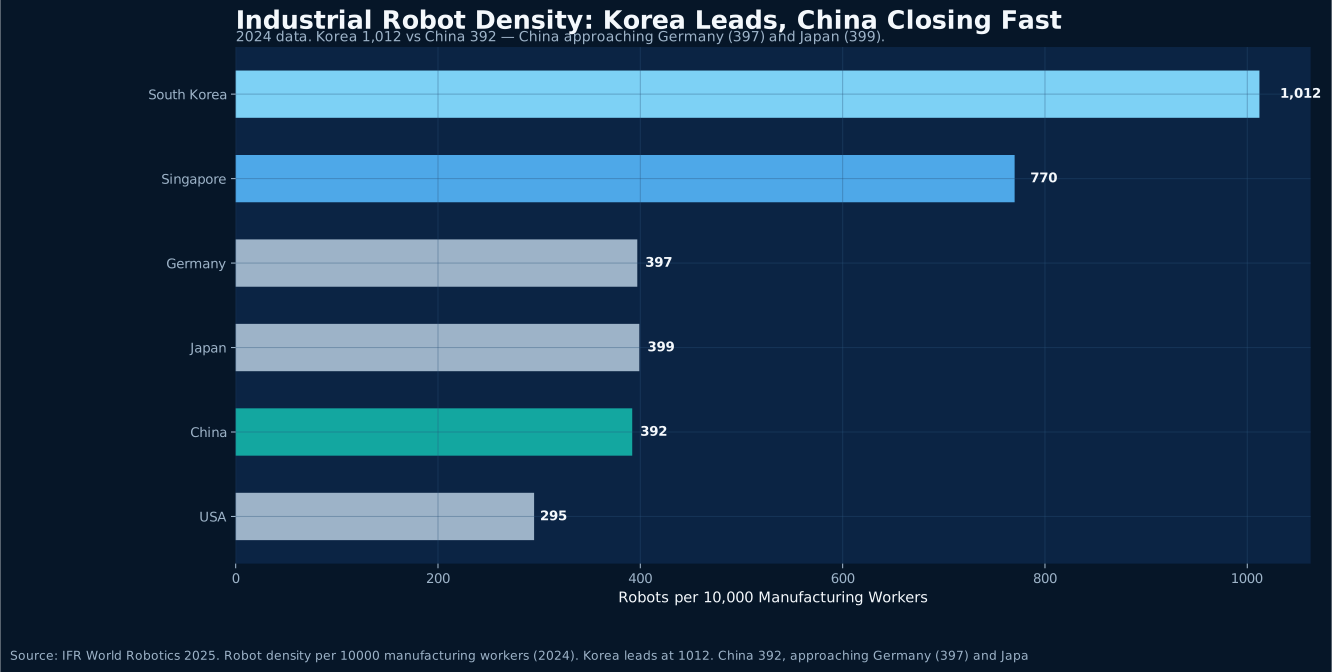
Korea leads globally with 1,012 robots per 10,000 manufacturing workers. China installed 295,000 units in 2024 (54% global share). Korea’s 2026 smart factory budget rose 70% to KRW 402B, while China’s MIIT blueprint pushes large AI models into manufacturing. Their automation complementarity is creating new trade opportunities.
Read Article
Semiconductors & AI Chips · 2026-05-18
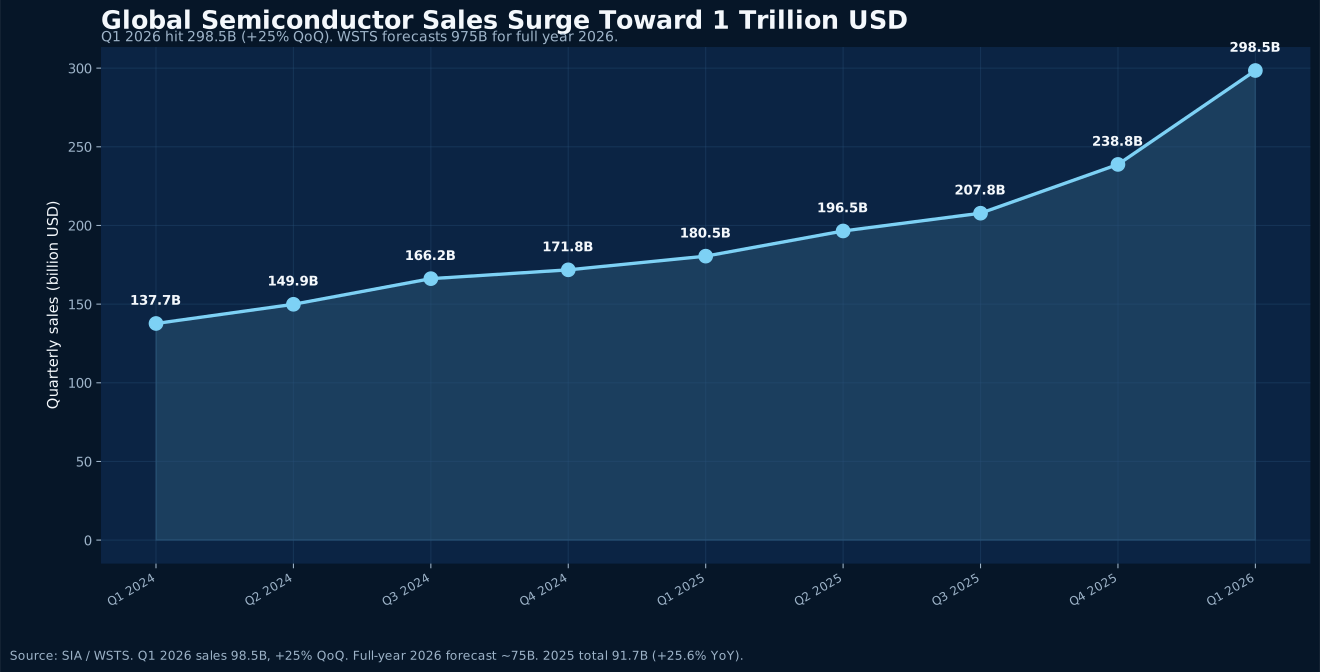
Global semiconductor sales hit $298.5B in Q1 2026, up 25% QoQ. Korea’s April chip exports surged to $31.9B driven by HBM and AI server demand, while China accelerates wafer self-sufficiency targets.
Read Article
Beauty & Cosmetics · 2026-05-18
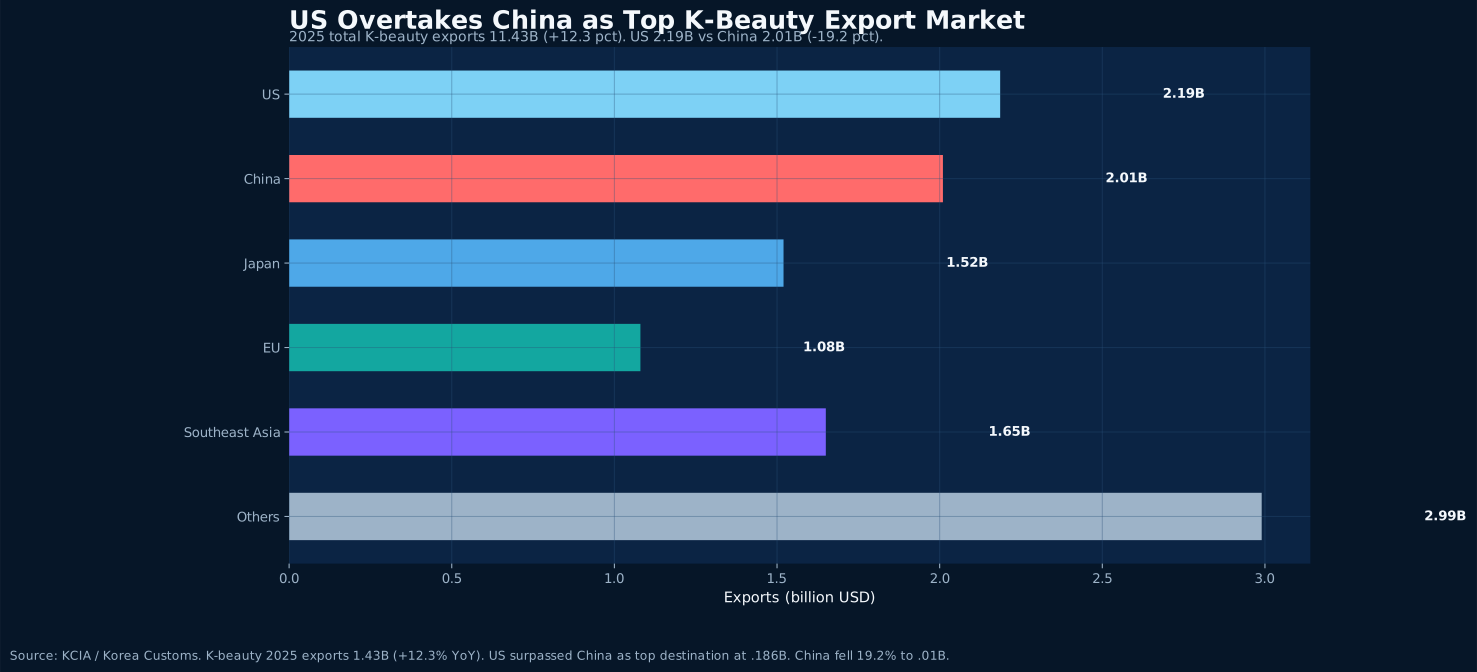
China’s NMPA launches a three-year e-label pilot across seven regions while Korea’s MFDS advances mandatory safety assessments by 2031. K-beauty exports hit $11.43B but China fell 19.2%, as bilateral regulatory convergence creates new compliant trade windows.
Read Article
International Trade Insight · 2026-05-11
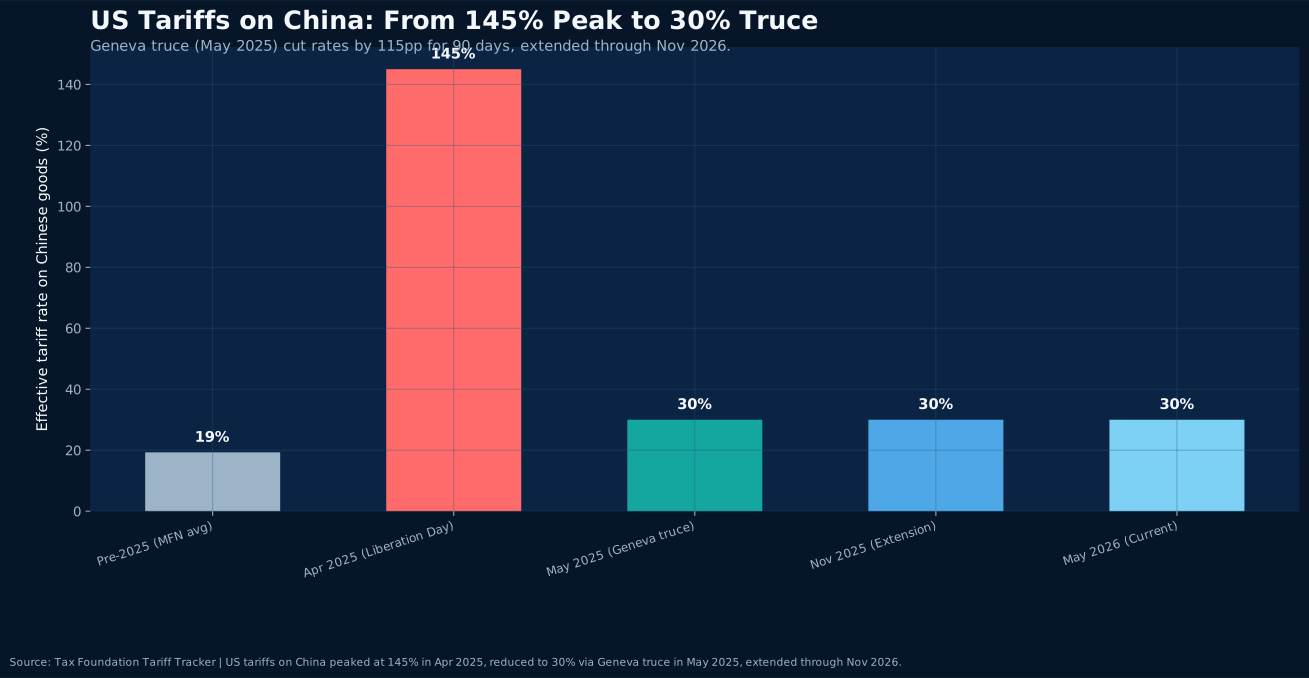
The US-China Geneva tariff truce cut duties from 145% to 30% and extended through November 2026. Korea, as China’s top semiconductor supplier and a US trade surplus partner, faces both transshipment scrutiny and strategic supply chain restructuring opportunities.
Read Article
Cross-Border E-Commerce Insight · 2026-05-11
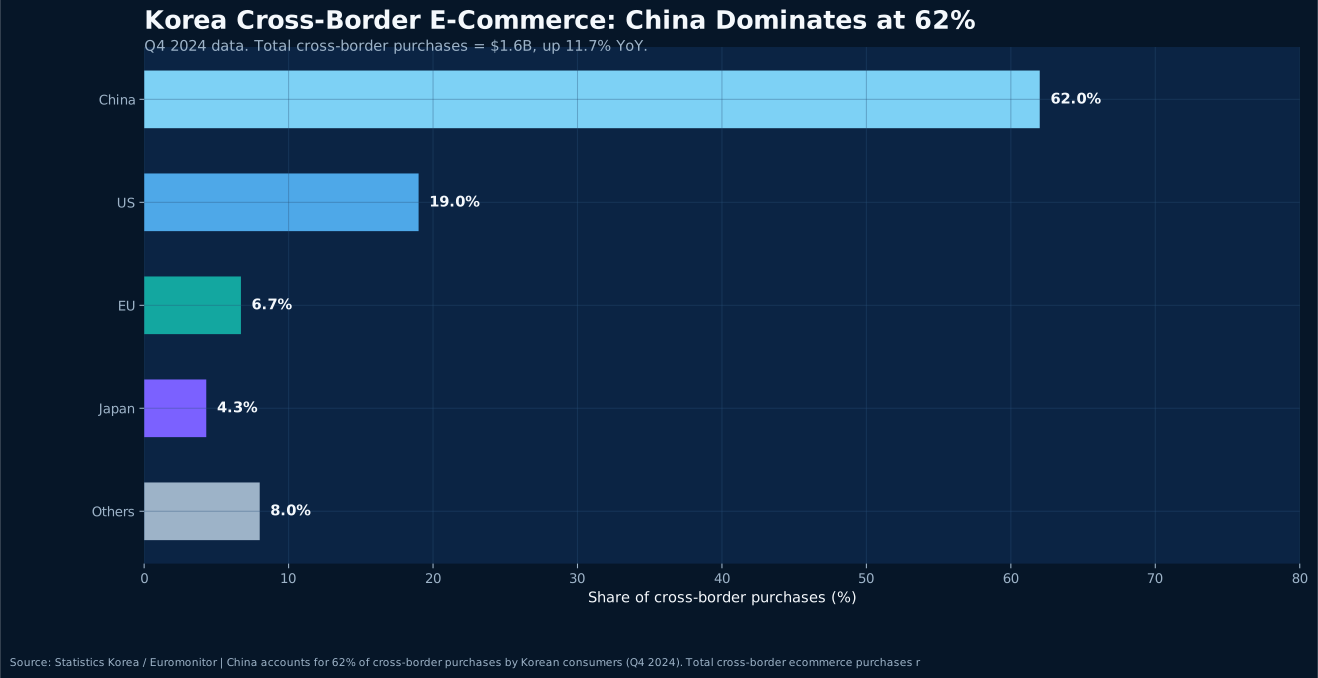
Chinese cross-border platforms command 62% of Korea's overseas direct purchase market, but Seoul inspections found 144 products with toxic substances exceeding safe limits. KFTC launched data compliance investigations. 2026 is the industry's 'Year of Compliance' as product safety, data protection, and consumer rights regulations escalate simultaneously.
Read Article
Food Trade Insight · 2026-05-11
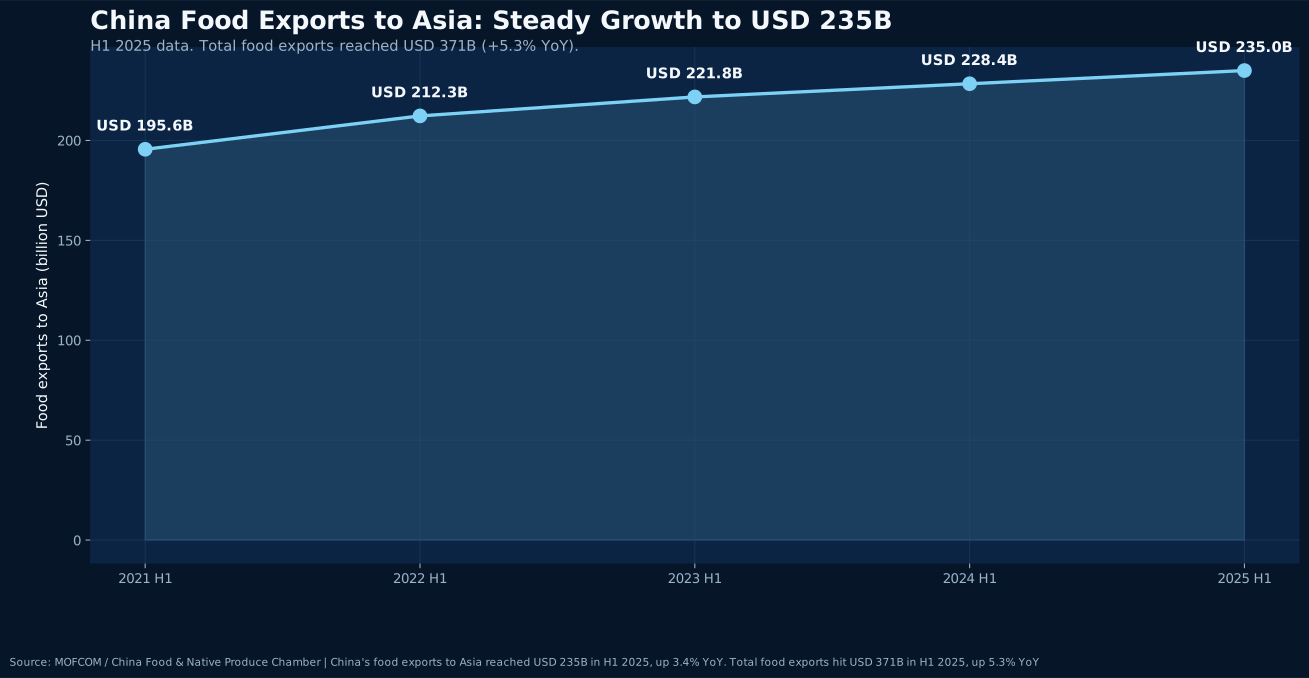
China's food exports to Asia reached $235B in H1 2025, but MFDS violations on Chinese food imports persist. Korea revised its Special Act on Imported Food Safety—simplifying poultry feed imports while tightening processed food scrutiny. China-Korea food trade firms must balance compliance investment with market opportunity.
Read Article
Supply Chain Insight · 2026-05-06
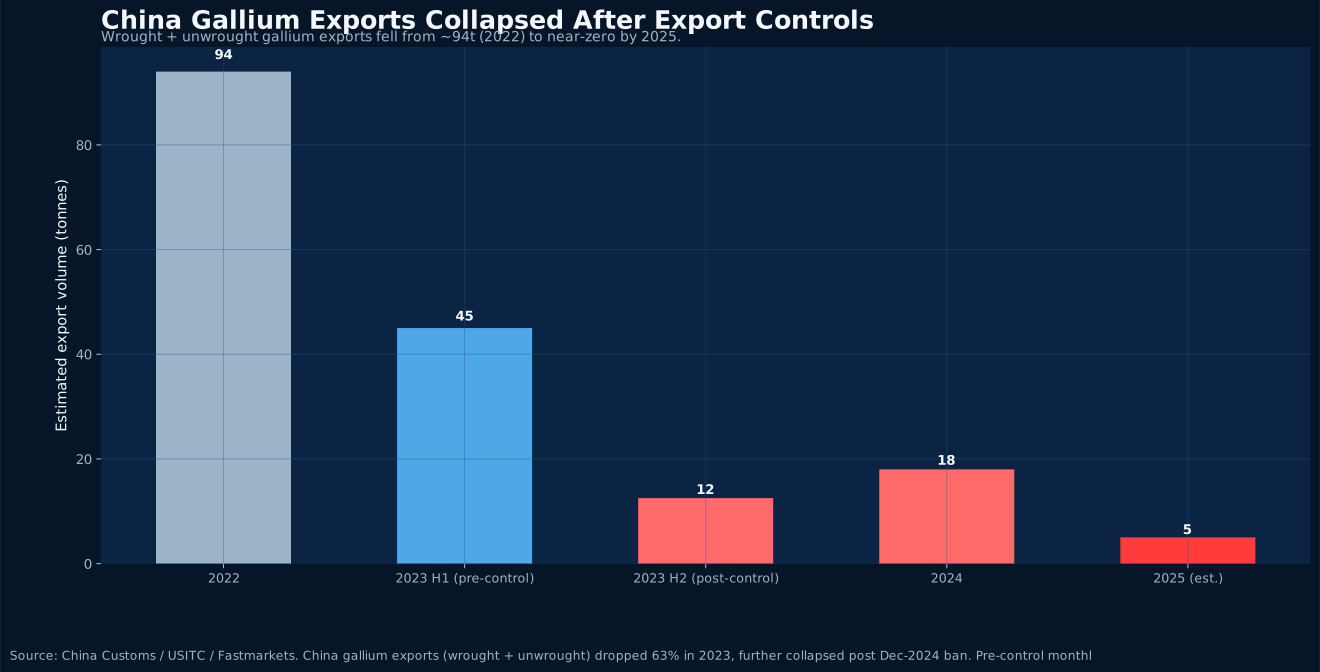
China’s escalating export controls on gallium, germanium, and antimony have reshaped global supply. Korea, a semiconductor and battery powerhouse, is responding through reserve expansion, dedicated funding, and international partnerships.
Read Article
Policy Insight · 2026-05-06
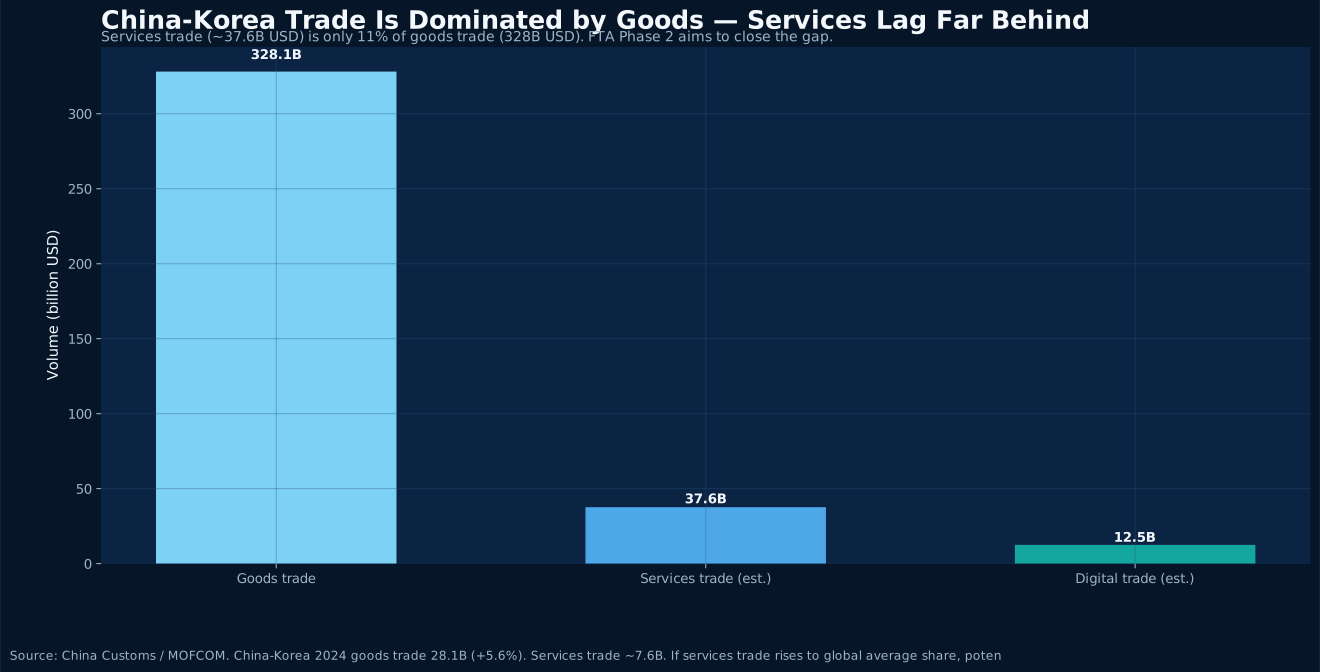
The 13th round of China-Korea FTA Phase 2 negotiations has been completed, with services trade, investment rules, and negative lists at the center. A 2026 breakthrough could shift bilateral economic relations from goods-dominated to services-plus-investment dual-driven.
Read Article
International Trade Insight · 2026-05-06
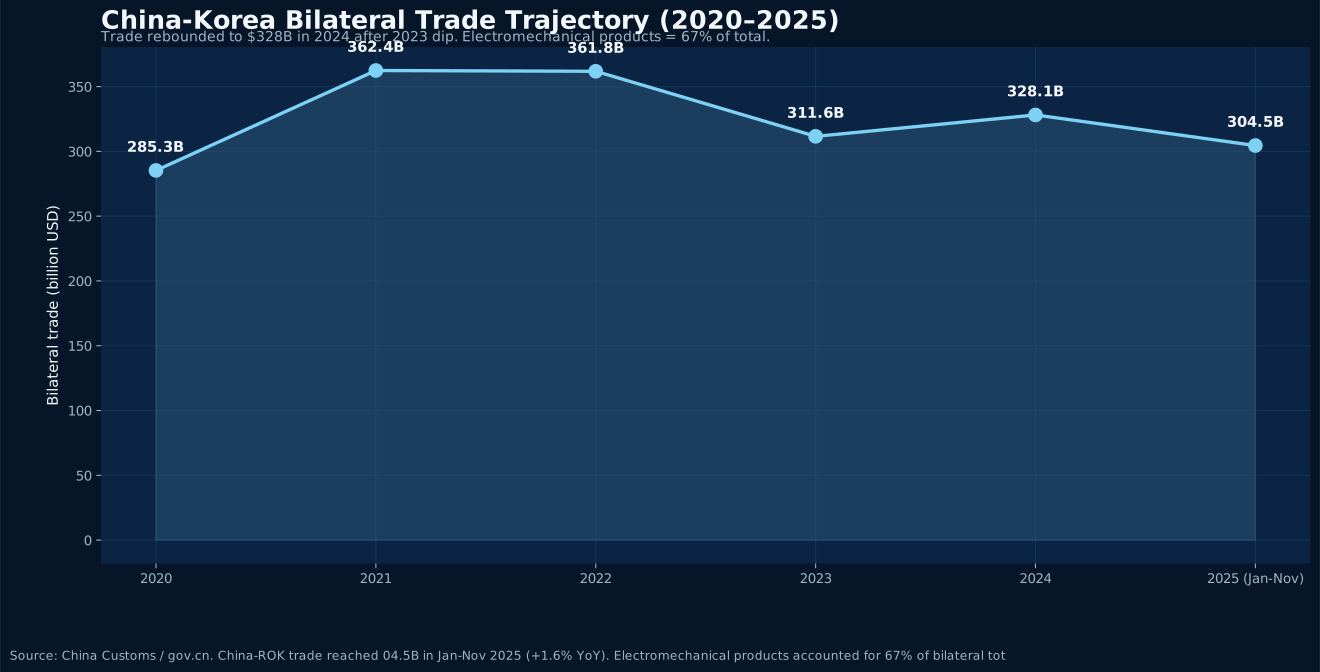
China hosts APEC 2026 with supply chain resilience, digital economy, and sustainable trade as core themes. China-Korea trade faces both regulatory adjustment pressure and strategic opportunities for industrial upgrading and market access under this multilateral framework.
Read Article
Beauty & Consumer Goods · 2026-04-25
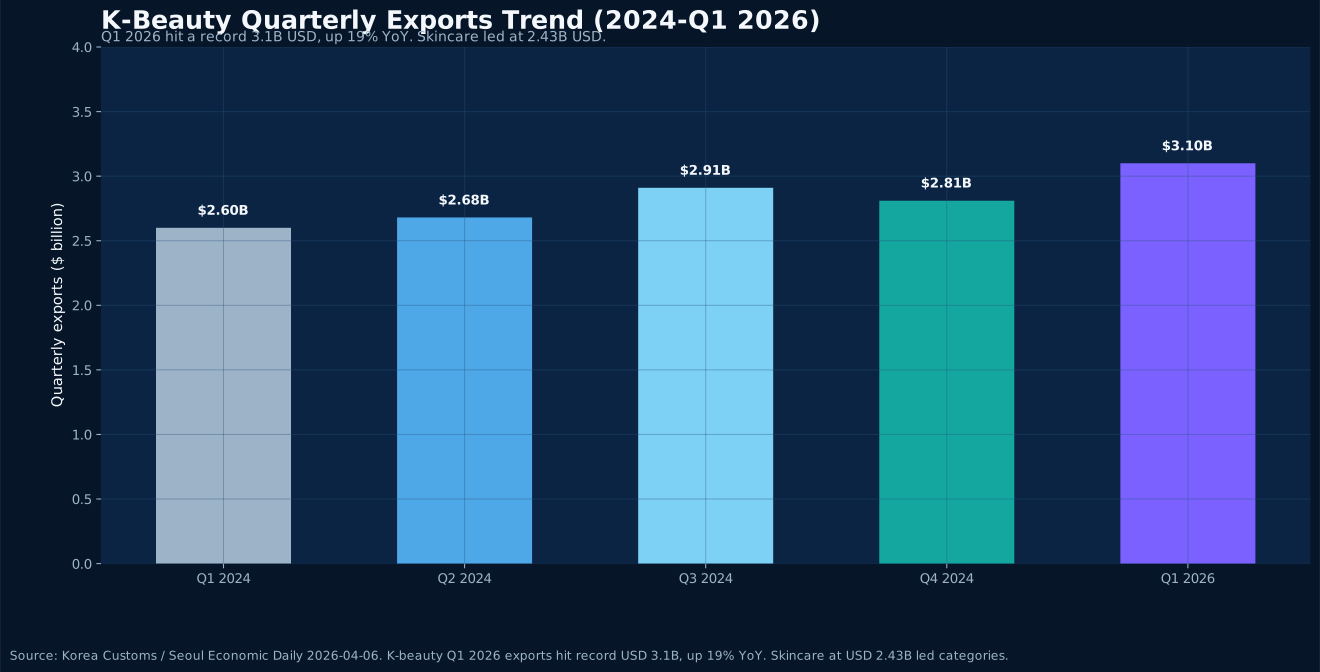
Korea's cosmetics exports hit a record USD 3.1 billion in Q1 2026, up 19% YoY. The US surpassed China as K-beauty's top market at USD 620 million (+40.9%).
Read Article
Cross-Border E-Commerce & Compliance · 2026-04-25
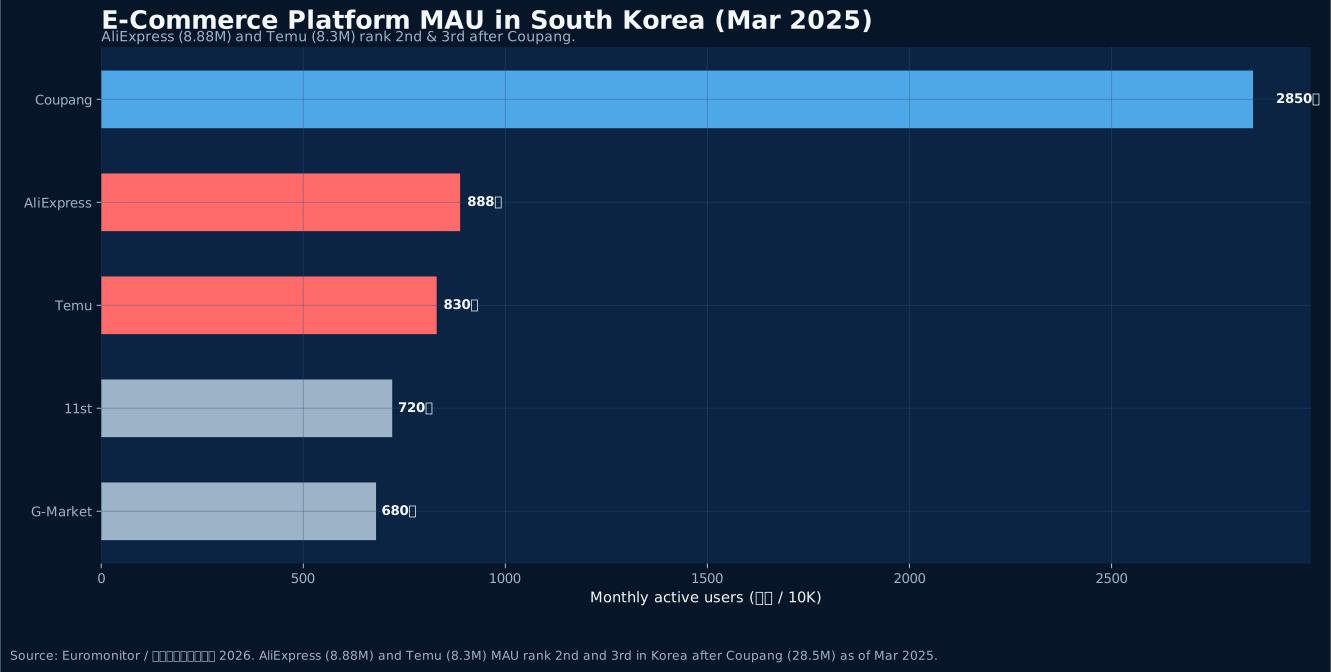
Chinese CBEC platforms account for nearly 50% of Korea's market, with AliExpress and Temu at 8.88M and 8.3M MAU. As global duty-free parcel policies end, 2026 is the 'Year of Compliance.'
Read Article
Semiconductors & Supply Chain · 2026-04-18
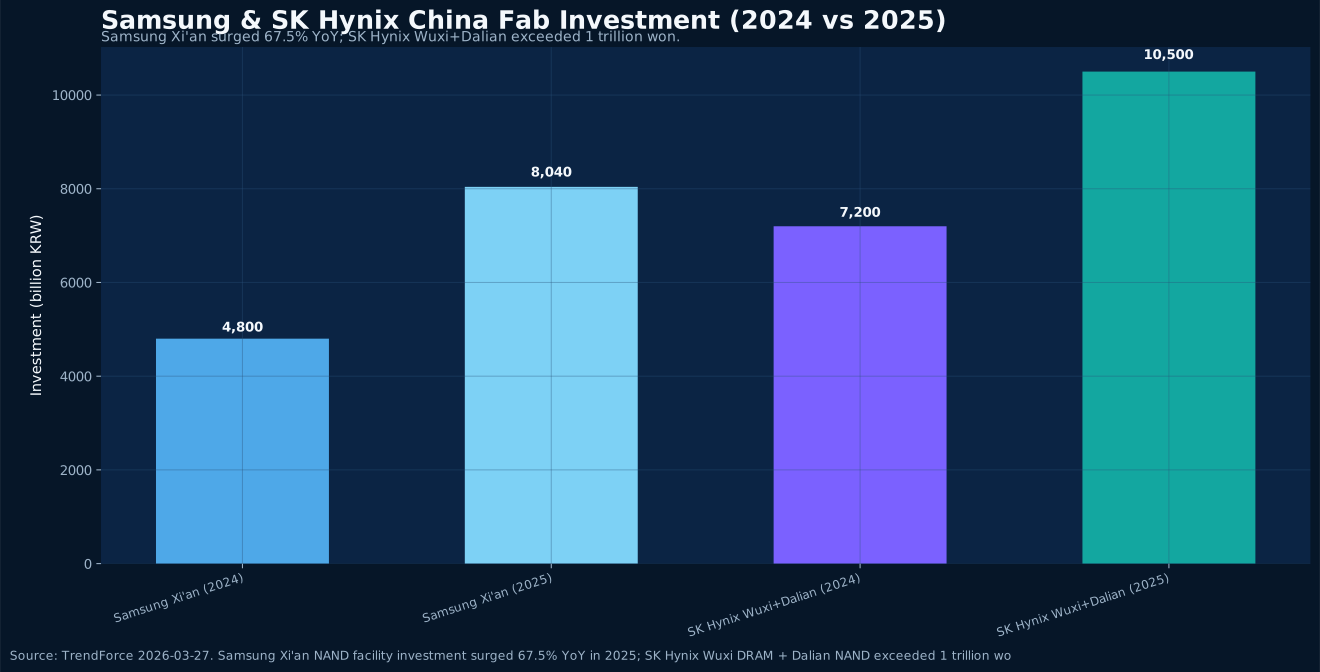
Samsung and SK Hynix face a new export control reality for their China chip fabs. The 2026 annual license system replaces the old waiver, even as both companies sharply boost China investment — Samsung Xi'an up 67.5%, SK Hynix Wuxi+Dalian topping 1 trillion won. We analyze the implications for Korea-China semiconductor trade.
Read Article
Finance & Digital Currency · 2026-04-18
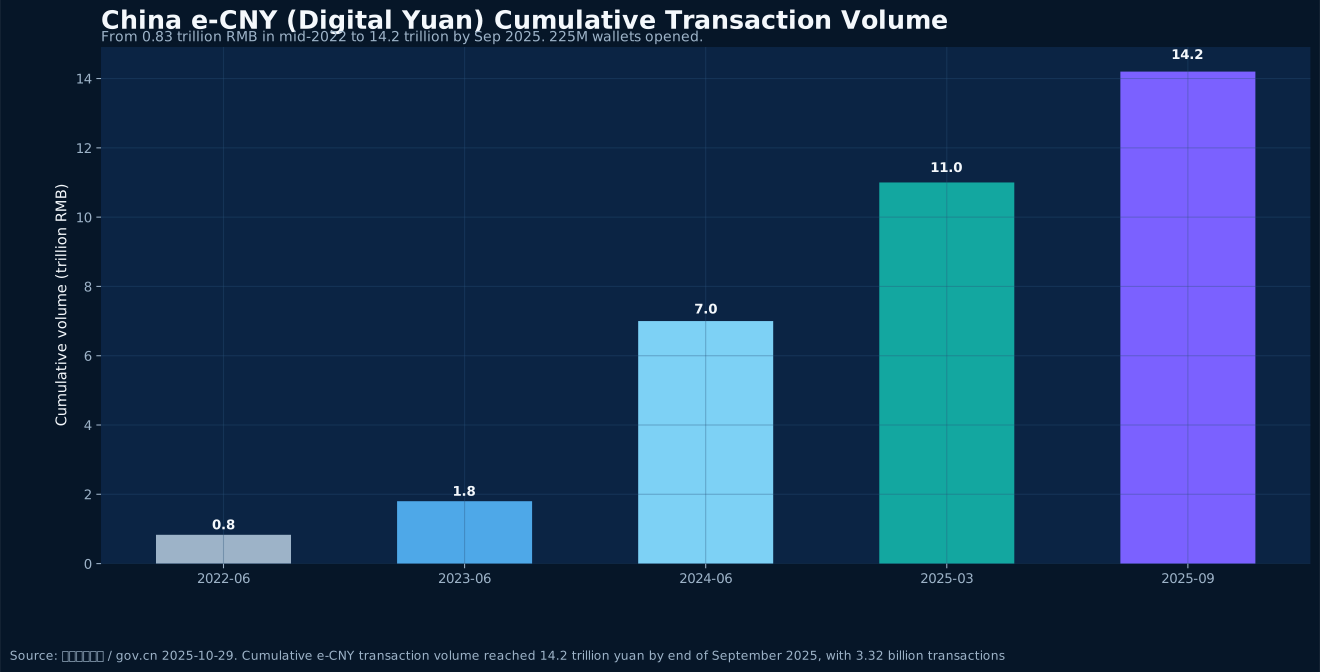
China's digital yuan (e-CNY) has surpassed 14.2 trillion RMB in cumulative transactions with 225 million wallets. Meanwhile, the China-led mBridge cross-border CBDC platform has processed over $55.49 billion — with e-CNY comprising 95%+ of settlement volume. We analyze the implications for Korea-China trade settlement.
Read Article
Agricultural Trade · 2026-04-14
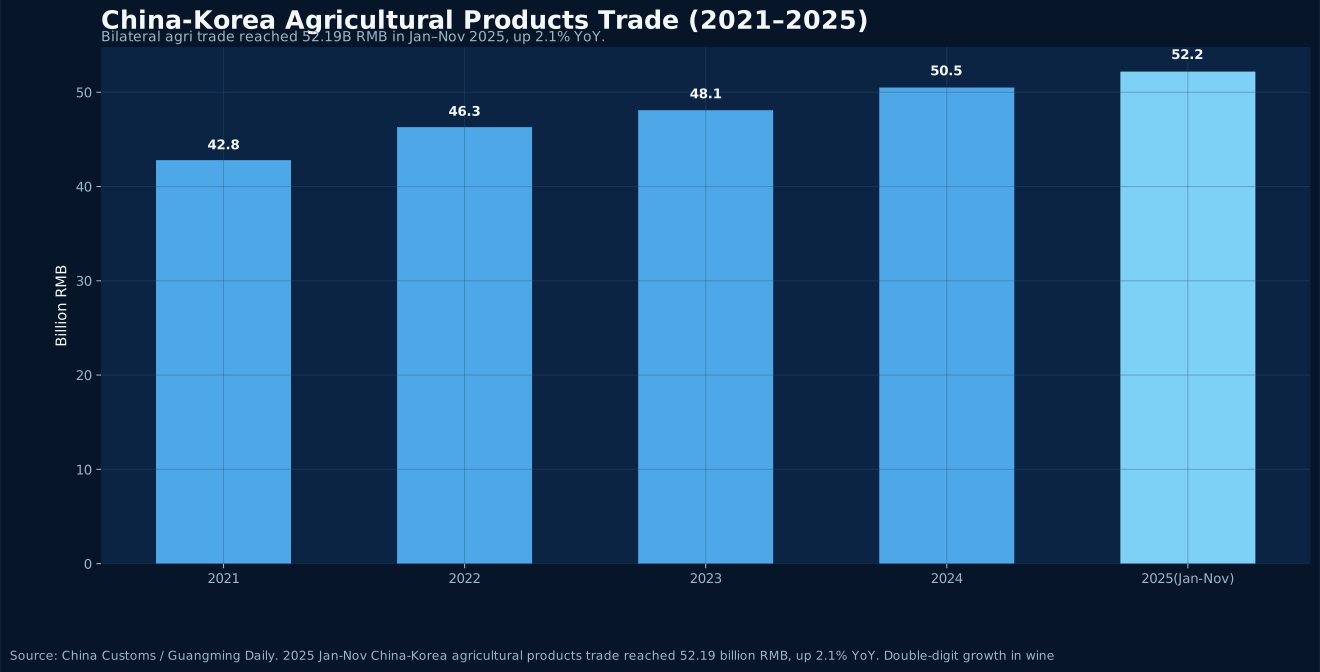
China-Korea agricultural trade reached 52.19 billion RMB in Jan–Nov 2025, up 2.1% YoY. Wine, beverages, dried fruits, and tea showed double-digit growth. China is Korea’s second-largest agricultural supplier.
Read Article
Cold Chain Logistics · 2026-04-14
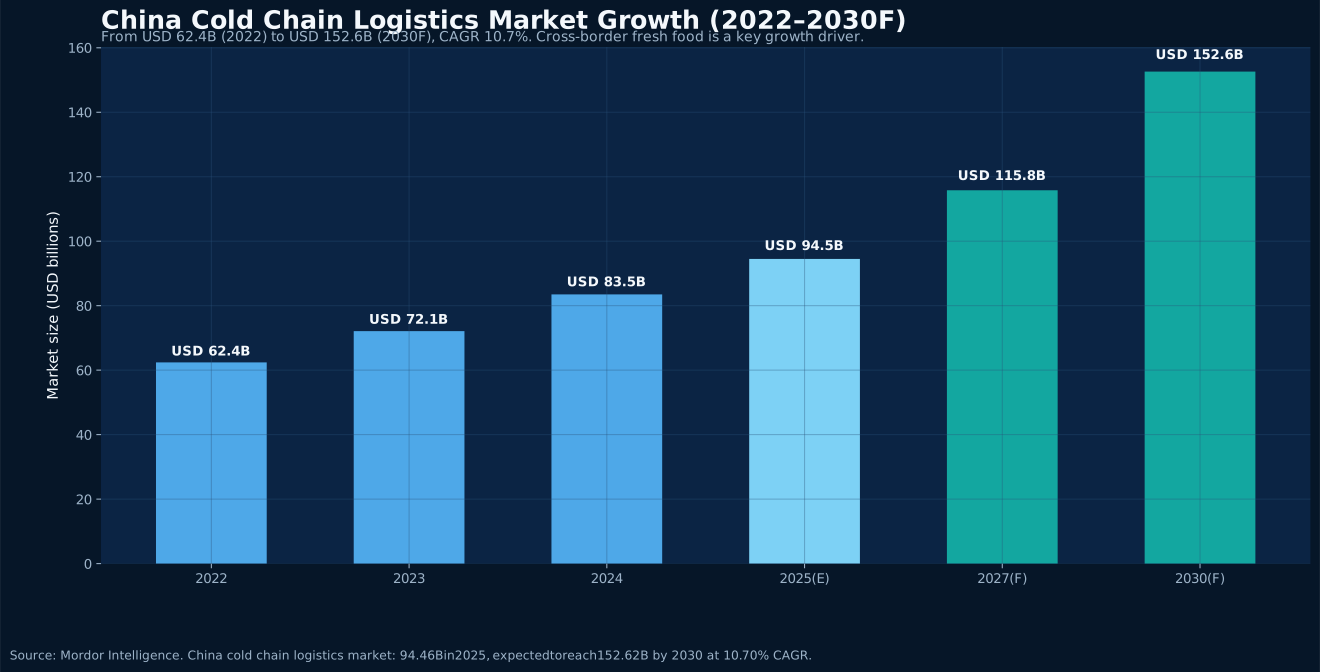
China’s cold chain logistics market reached USD 94.46B in 2025, growing at 10.7% CAGR. China holds 38% of Asia-Pacific share, Korea 9.2%. Cross-border fresh food e-commerce is emerging as a new growth driver for bilateral cold chain cooperation.
Read Article
Livestream E-Commerce · 2026-04-14
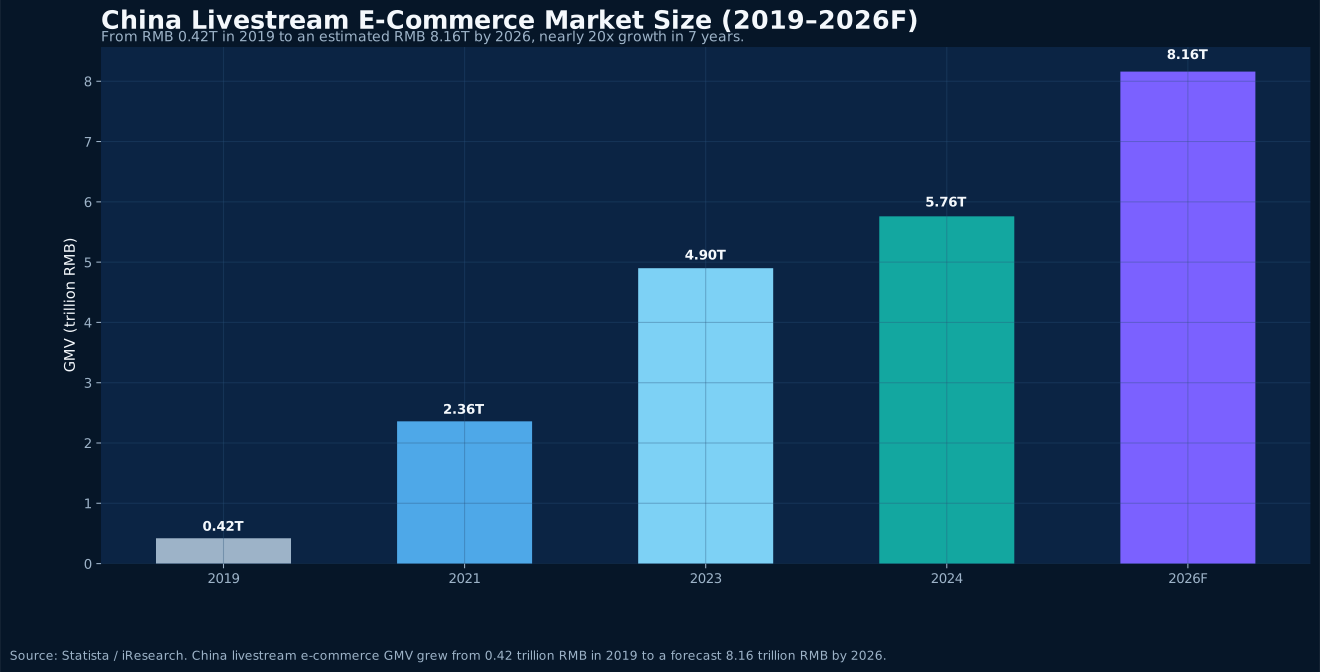
China’s livestream e-commerce market is projected to reach RMB 8.16 trillion by 2026, while 60% of Korean consumers have purchased via live shopping. As both countries tighten regulations, cross-border livestream compliance is becoming a new trade topic.
Read Article
Carbon Border Tax · 2026-04-14
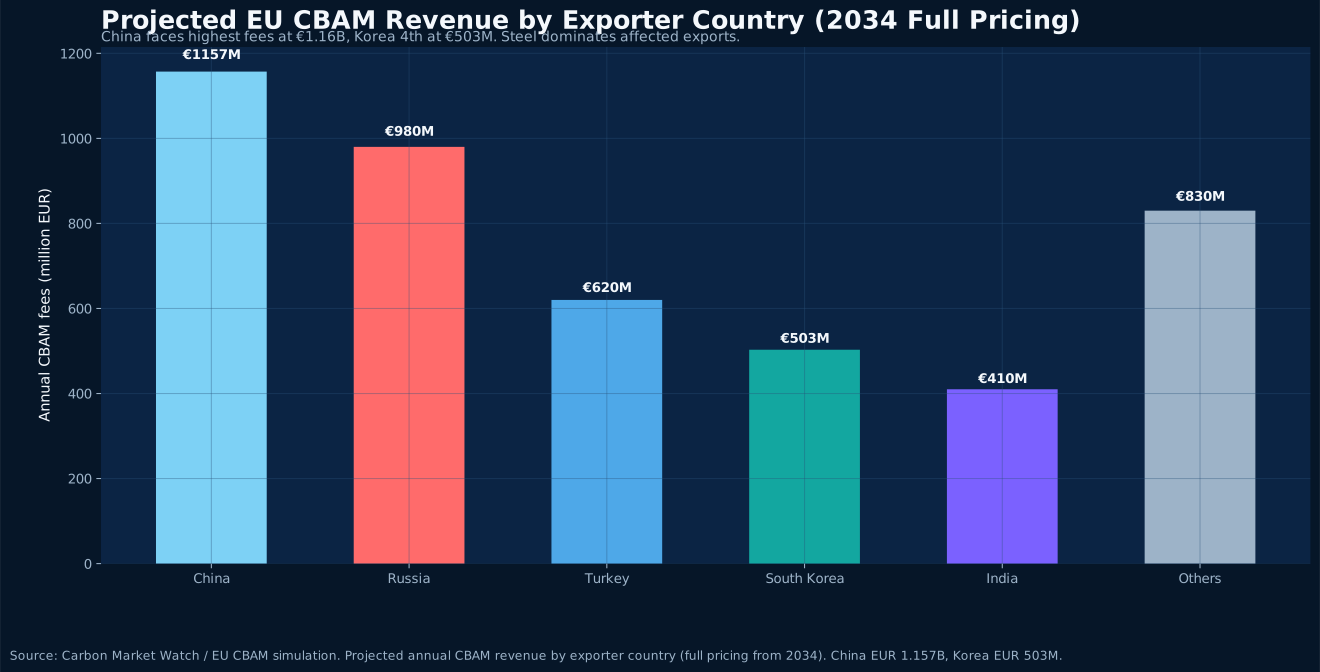
The EU CBAM began levying carbon tariffs in January 2026. Korea’s steel exports to the EU total USD 1.52B, aluminum USD 186M. Under full pricing, Korea faces €503M in annual fees. China-Korea firms face urgent green transition pressure.
Read Article
Trade Policy · 2026-04-12
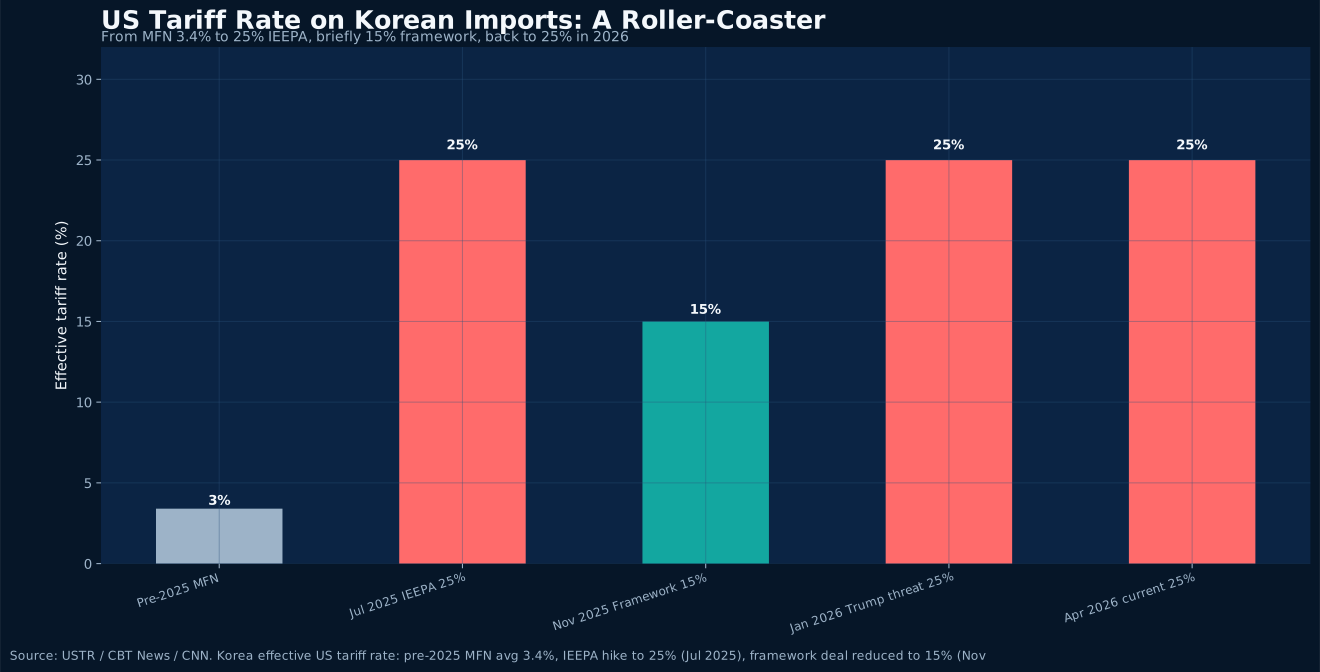
The Trump administration raised Korea tariffs back to 25% in January 2026, forcing Korean conglomerates into simultaneous domestic and US investment surges. This dual-track strategy is fundamentally altering how the China-Korea supply chain operates.
Read Article
Health Industry · 2026-04-11
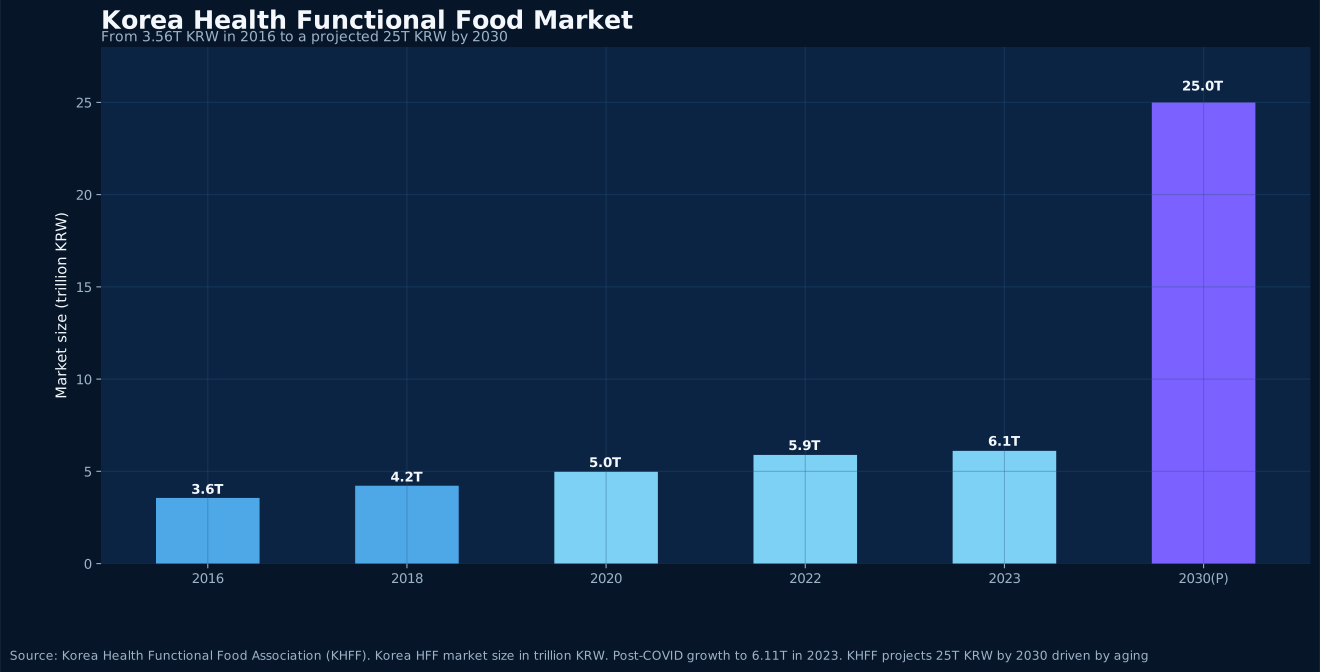
Korea’s health functional food market has surpassed 6 trillion KRW and is projected to reach 25 trillion by 2030. Chinese suppliers have opportunities across ingredients, OEM, and finished goods—but MFDS compliance is non-negotiable.
Read Article
Cultural Trade · 2026-04-11
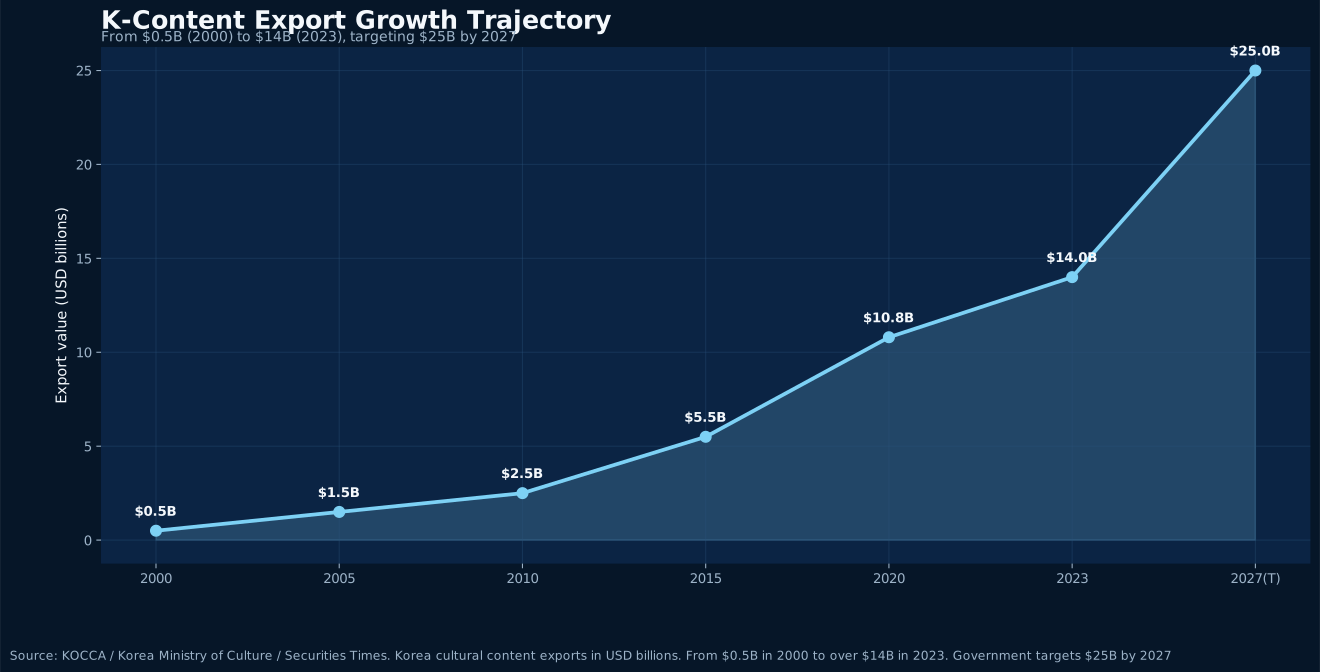
Korea’s cultural content exports have surpassed $14 billion, targeting $25 billion by 2027. China and Japan absorb over 50% of Hallyu exports, but China’s policy environment remains in flux.
Read Article
Tech Industry · 2026-04-11
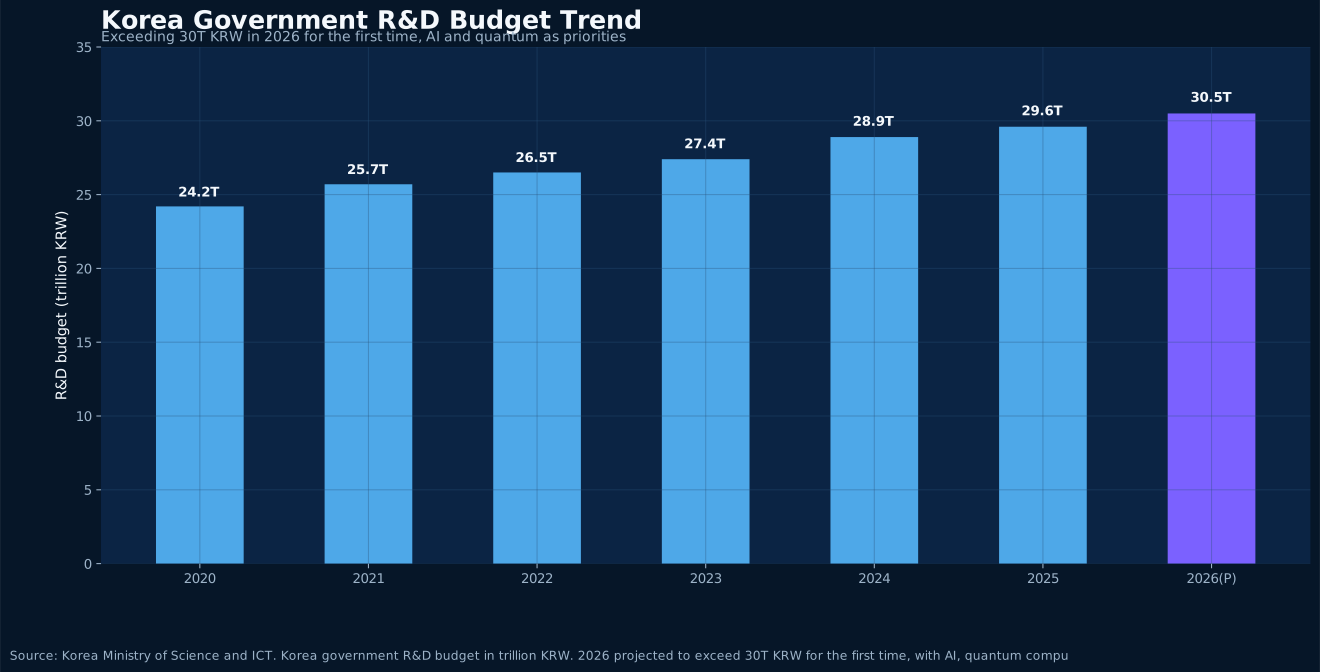
Korea’s 2026 R&D budget exceeds 30 trillion KRW for the first time, with AI and quantum as priorities. China-Korea AI supply chain complementarity is moving from research papers to capital.
Read Article
Policy & Tariffs · 2026-04-10
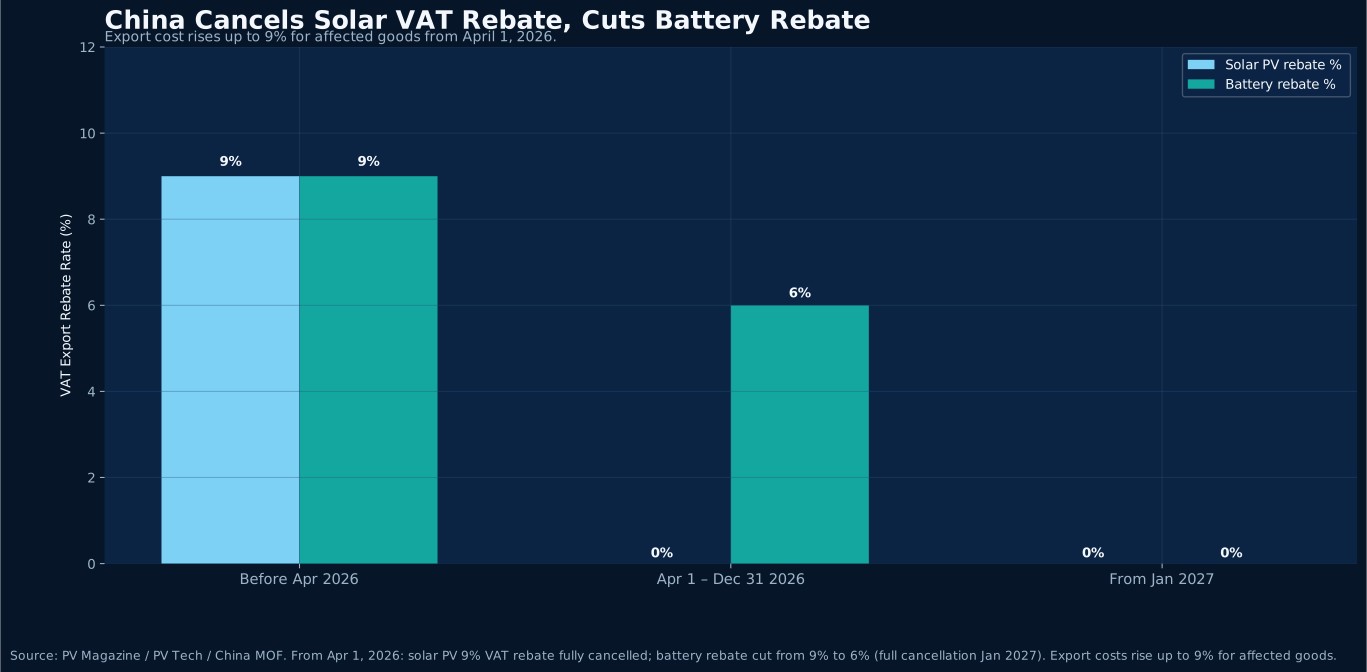
From April 1, 2026, China eliminates the 9% VAT export rebate on solar PV products and cuts battery rebates from 9% to 6% (full phase-out from 2027). Export costs rise up to 9%, reshaping Korea's clean energy supply chain.
Read Article
Cross-Border E-Commerce · 2026-04-10
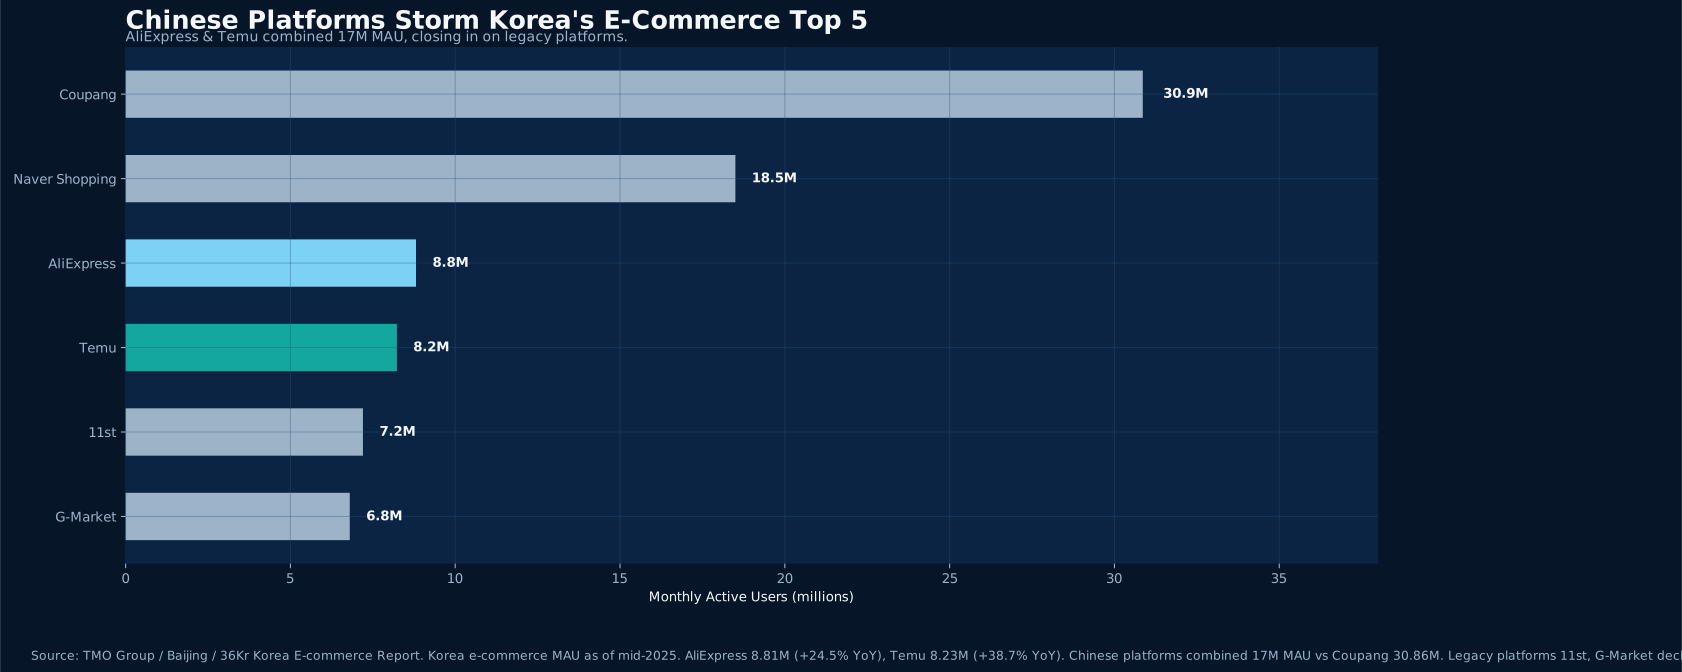
In 2025, AliExpress and Temu reached a combined 17 million MAU in Korea, growing 24.5% and 38.7% YoY respectively. Chinese cross-border e-commerce's share of Korea's overseas direct purchases surged from 41% (2022) to 77% (H1 2025).
Read Article
FTA & Policy · 2026-04-10
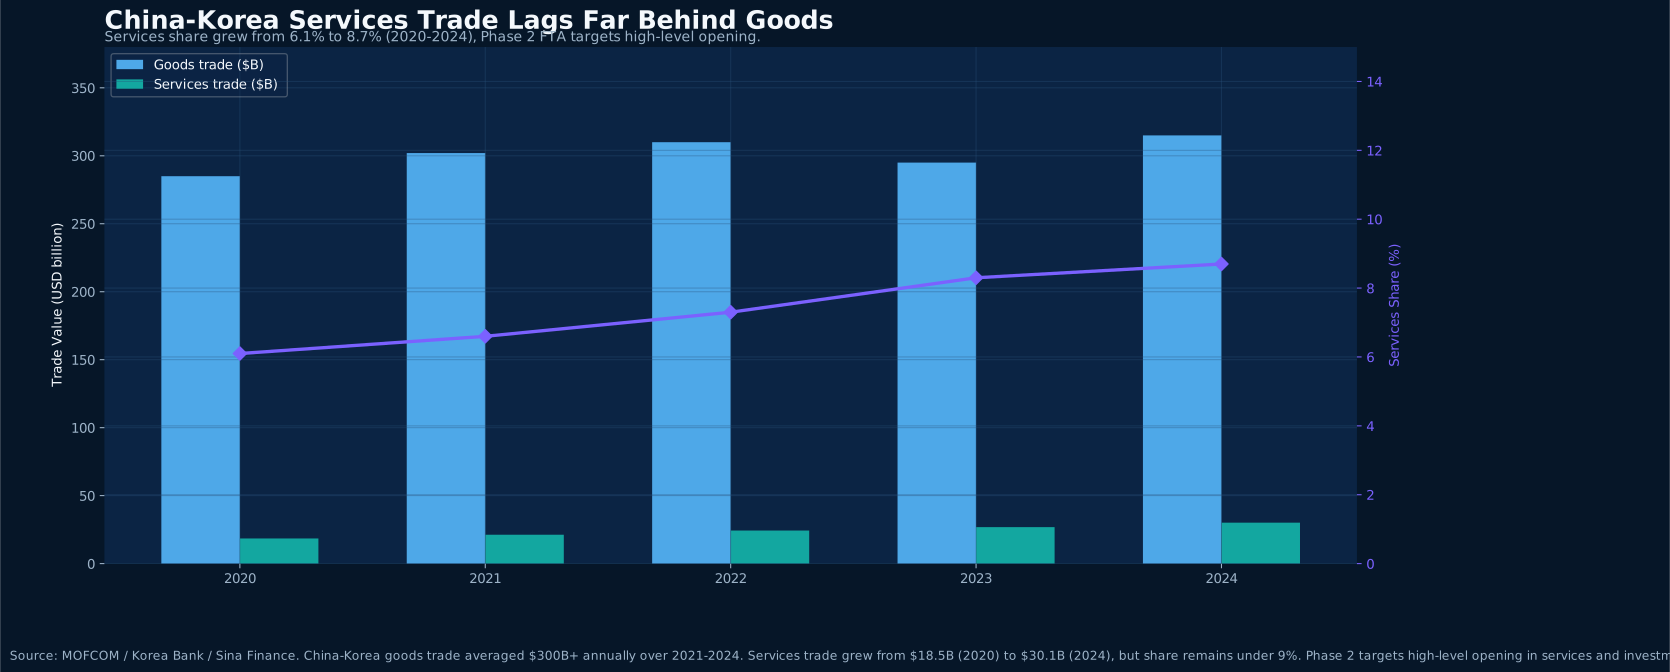
The 13th round of China-Korea FTA Phase 2 negotiations was held in Beijing in January 2026, with deep consultations on cross-border services, investment, and financial services. Leaders agreed to achieve substantial progress within 2026. Services trade accounts for less than 9% of bilateral trade — the opening potential is enormous.
Read Article
Policy & Tariffs · 2026-04-10
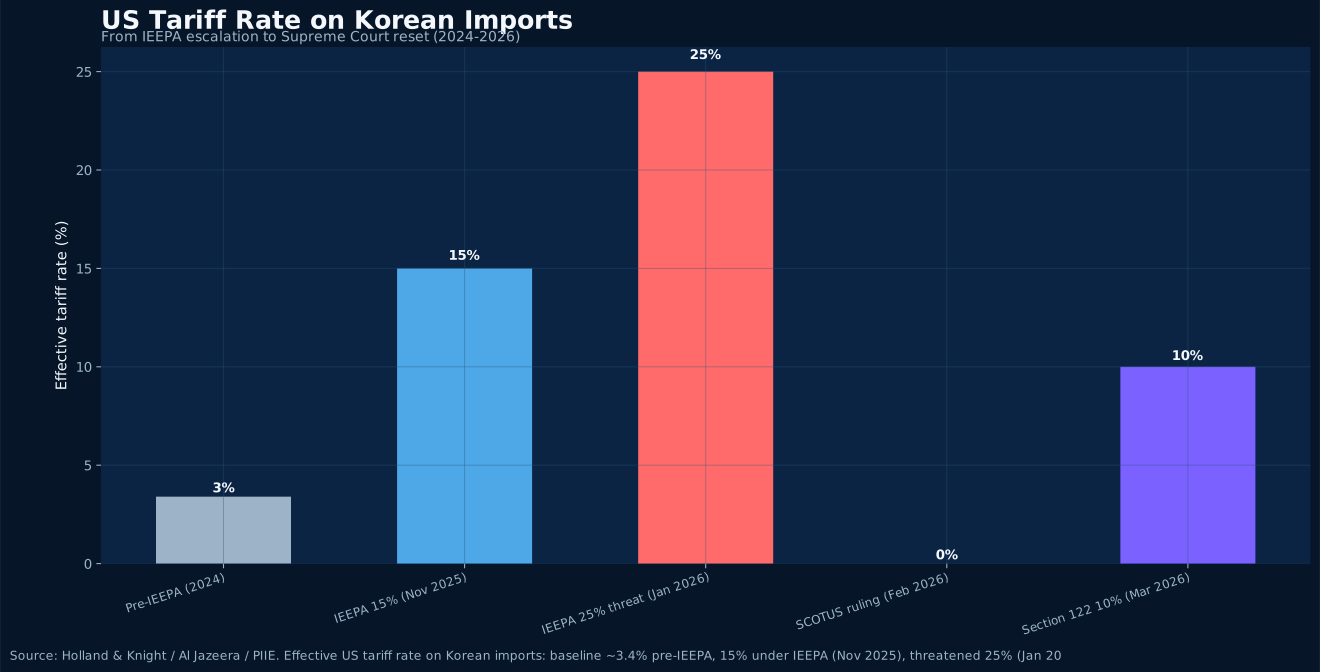
On February 20, 2026, the US Supreme Court ruled 6-3 that IEEPA does not authorize presidential tariffs, invalidating all related executive orders. This landmark decision reshapes not only US-Korea trade law but introduces new variables for China-Korea commerce. We trace the full arc from IEEPA escalation to judicial reset and analyze impacts on supply chains, cross-border e-commerce, and exporters.
Read Article
Cross-Border E-Commerce · 2026-04-10
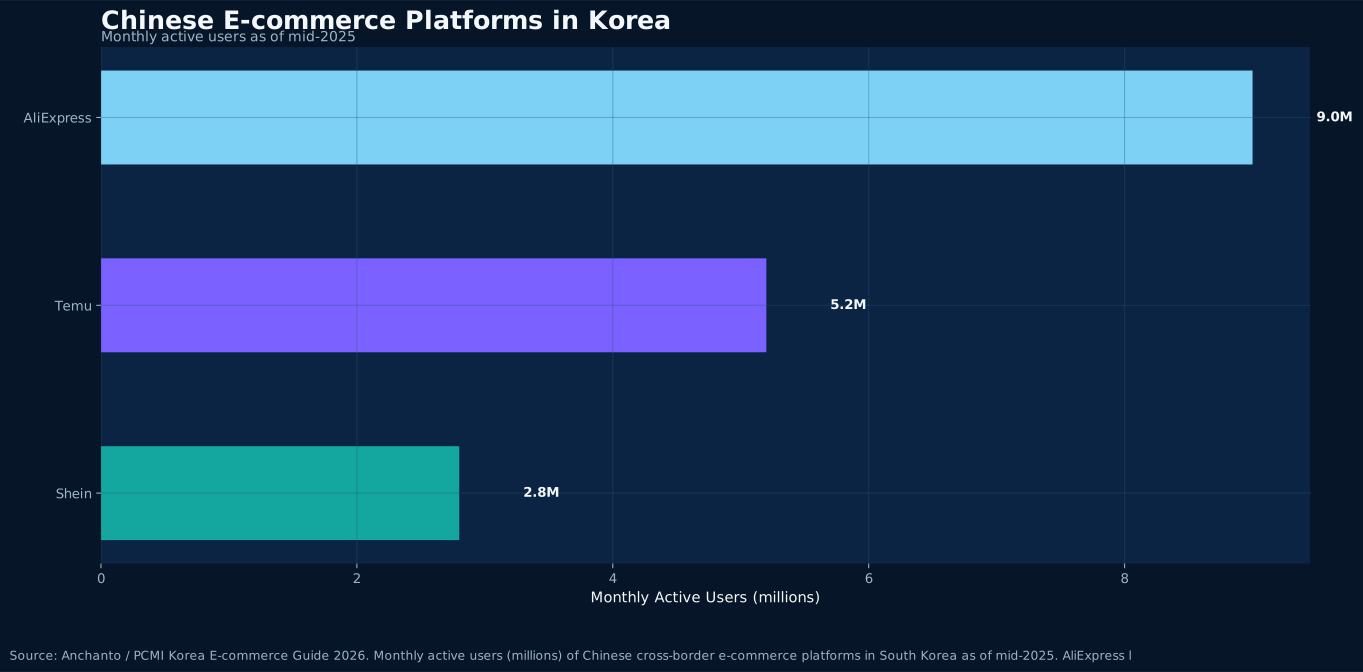
Korean consumers spent $3.1 billion on Chinese e-commerce platforms in 2024, an 84% YoY surge. AliExpress leads with 9 million monthly active users, followed by Temu and SHEIN. This China-platform-led cross-border wave is fundamentally changing Korea's retail competition, logistics infrastructure demands, and the microstructure of China-Korea trade.
Read Article
Beauty Insight · 2026-04-10
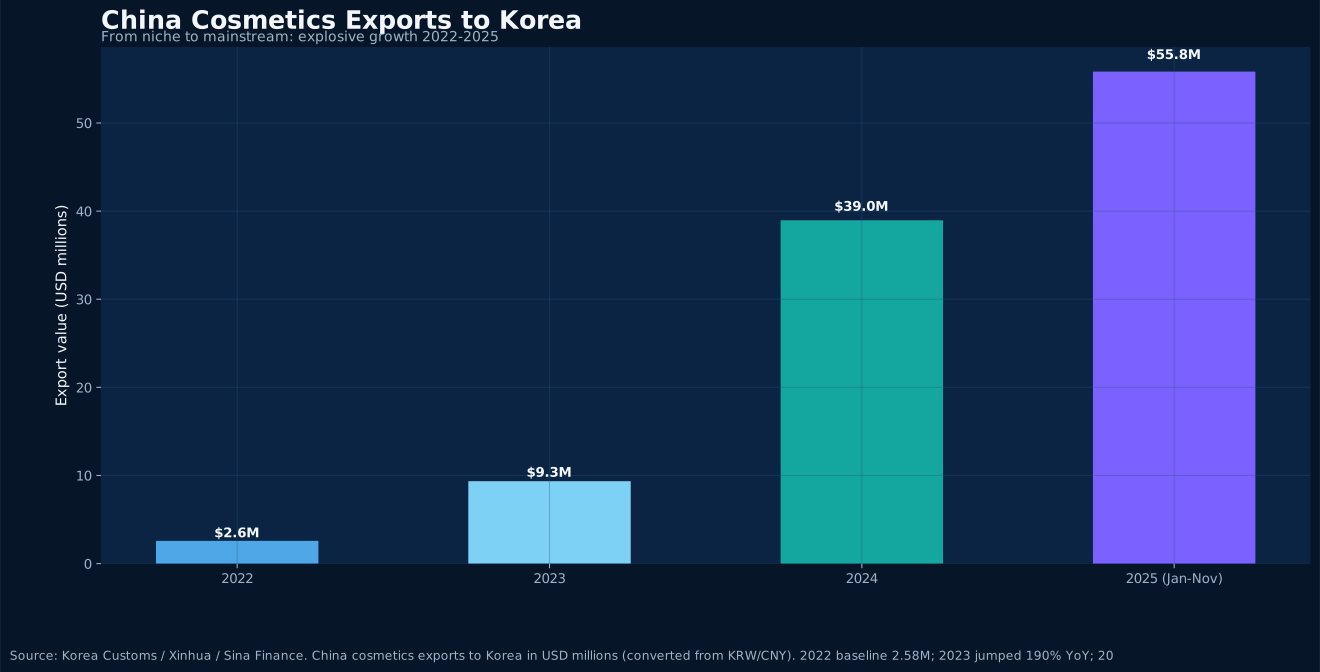
In the first 11 months of 2025, China's cosmetics exports to Korea reached $55.83 million, surpassing all of 2024. Korean consumers' cross-border purchases of Chinese cosmetics hit $155 million in Q1-Q3 2025, up 39.6% YoY. The China-Korea beauty trade — once defined by K-beauty's dominance — is undergoing a quiet role reversal.
Read Article
Petrochemical Insight · 2026-04-09
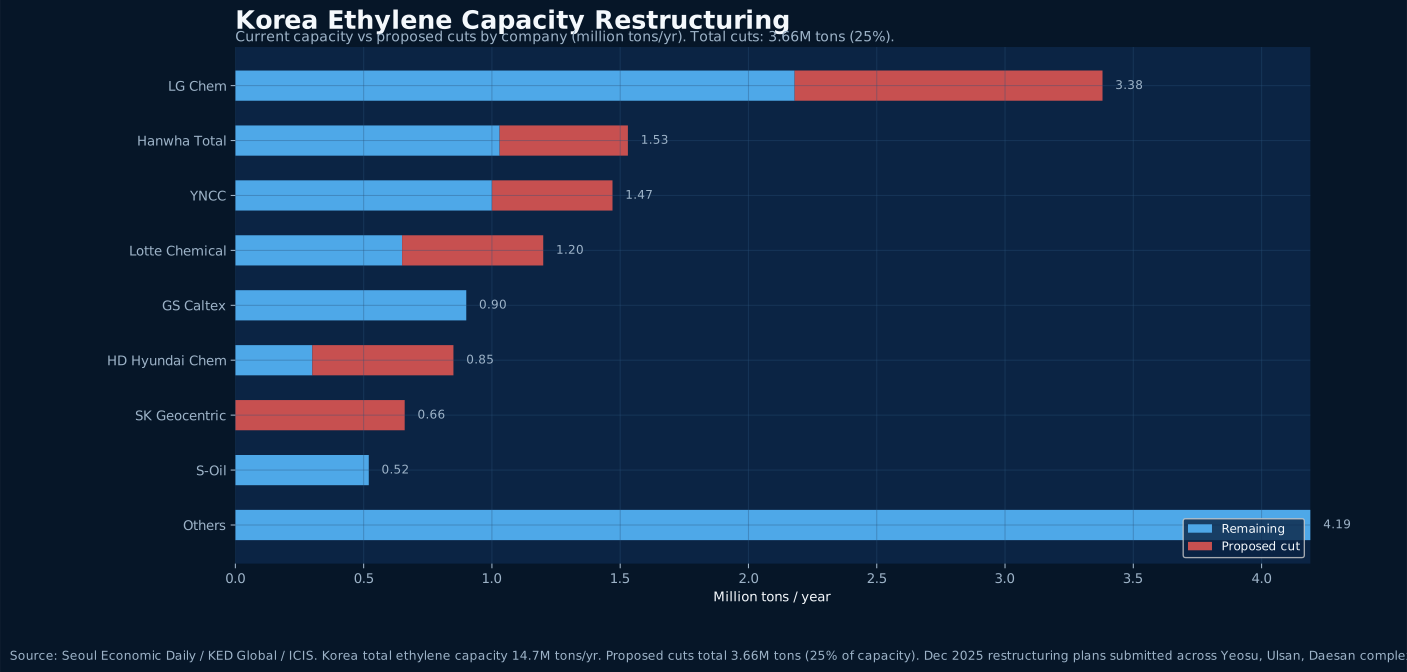
Facing China’s massive petrochemical capacity expansion, Korea’s petrochemical industry is undergoing its most severe structural adjustment in two decades. Export volumes fell to 12.3M tons in 2024, and ten major firms submitted plans to cut 3.66M tons of ethylene capacity.
Read Article
Seafood Insight · 2026-04-09
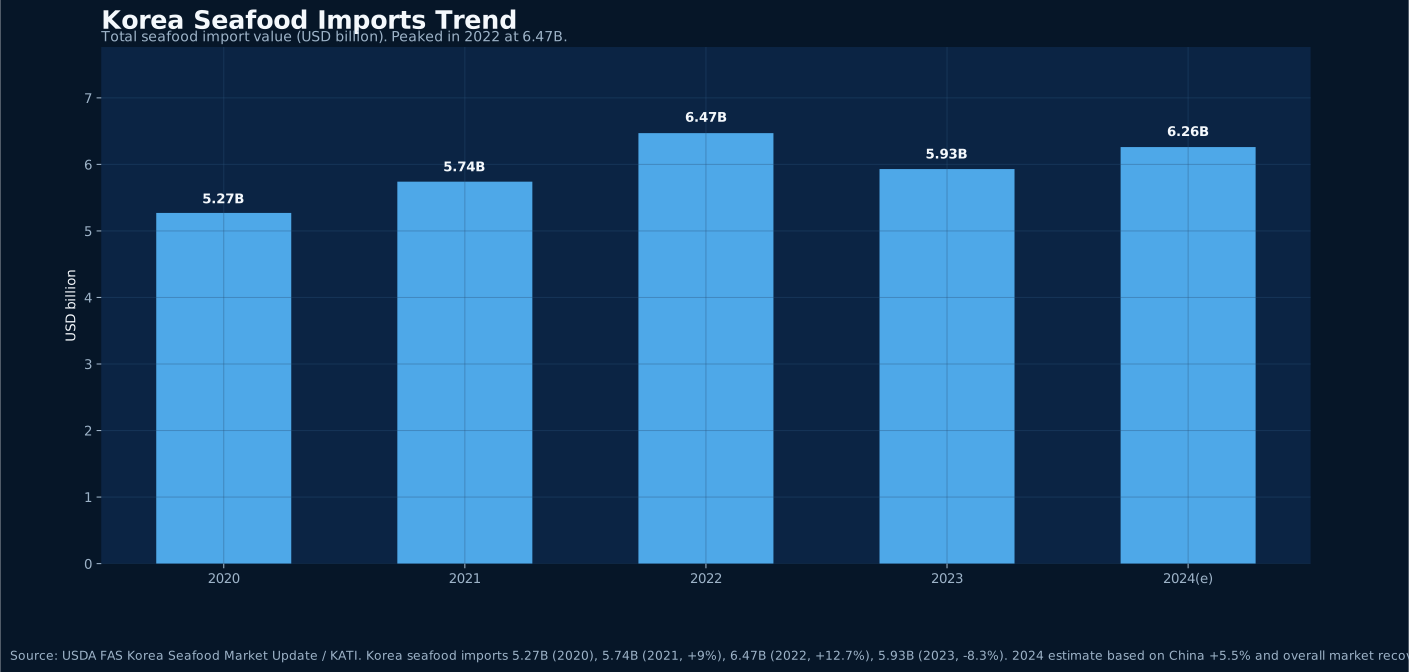
Korea’s seafood imports exceed 6 billion USD, with China overtaking Russia in 2023 as the top supplier. As Korea’s domestic production continues to decline and aquaculture accounts for over 62%, the China-Korea seafood trade structure is undergoing a profound shift.
Read Article
Tourism Trade Insight · 2026-04-09
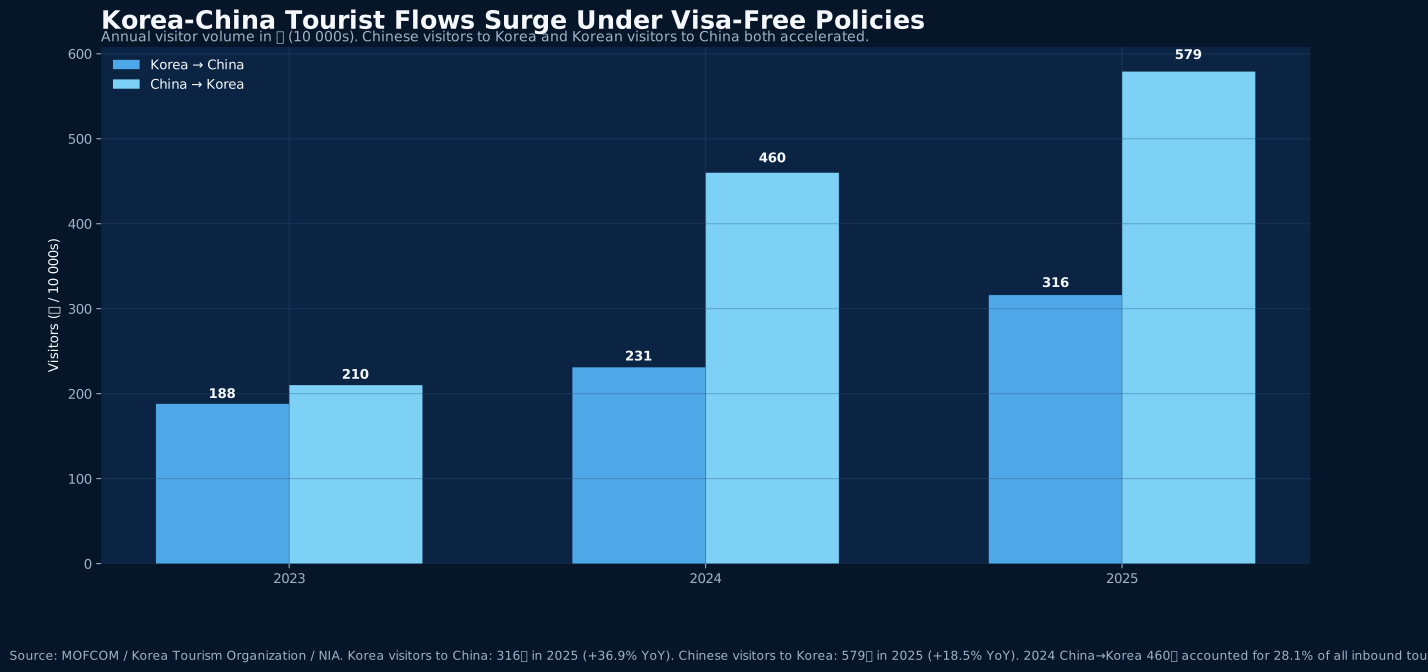
Korean visitors to China hit 3.16 million in 2025 (+36.9% YoY) while Chinese visitors to Korea reached 5.79 million (+18.5%). Visa-free policies are driving a shift from duty-free shopping toward experience-led consumption.
Read Article
Biotech Insight · 2026-04-09
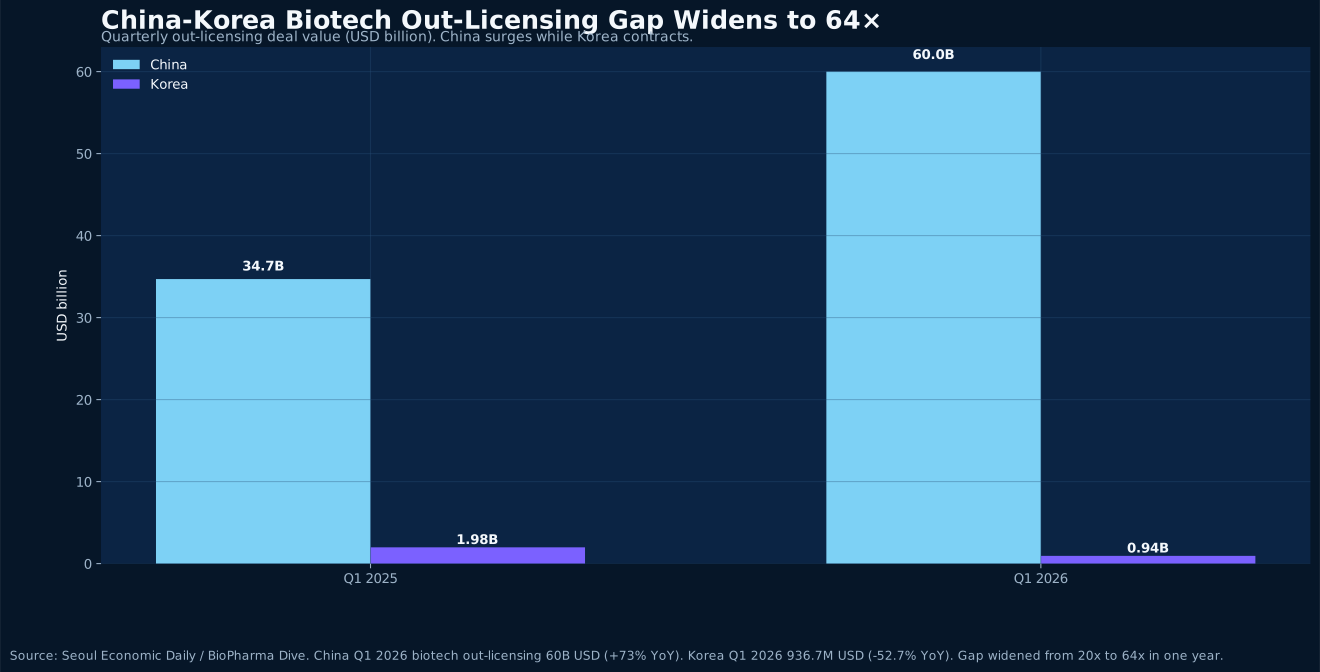
In Q1 2026, China’s biotech out-licensing deals totaled USD 60 billion (+73% YoY), while Korea managed just USD 937 million (−52.7%). The technology export gap widened from 20× to 64× in a single year as Chinese innovative drugs reshape the global biopharma landscape at unprecedented speed.
Read Article
Game Export Insight · 2026-04-09
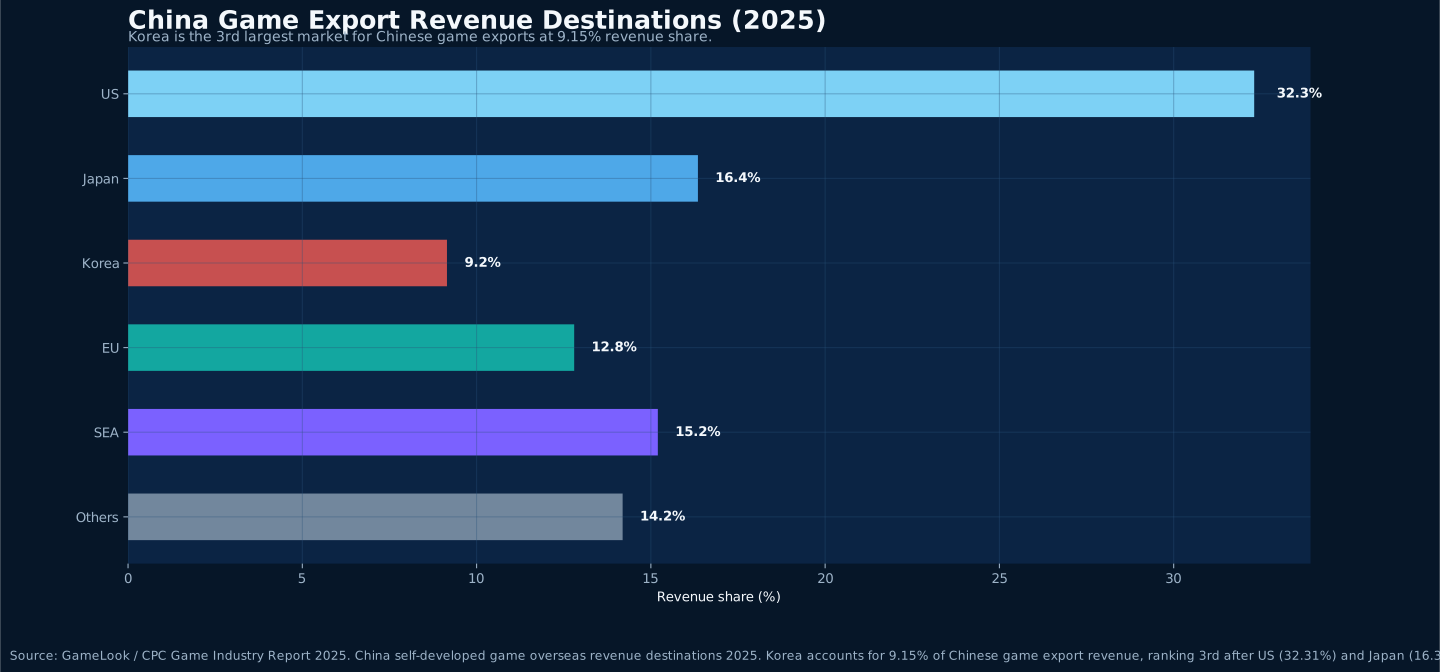
Korea accounted for 9.15% of revenue destinations for Chinese self-developed game exports in 2025, ranking behind only the U.S. and Japan. At the same time, Korea's game market is still expanding and mobile continues to gain share. The real barrier is no longer market entry itself, but whether localization, compliance disclosure, and operating rhythm can be executed together.
Read Article
Digital Economy Insight · 2026-04-09
Korea is now the third-largest market for Chinese game exports, accounting for 9.15% of overseas revenue from China-developed games. As Korea abolishes pre-release game censorship and tightens loot-box regulations, Chinese developers face both new opportunities and new challenges in a reshaped regulatory landscape.
Read Article
Semiconductor & Chips · 2026-04-08
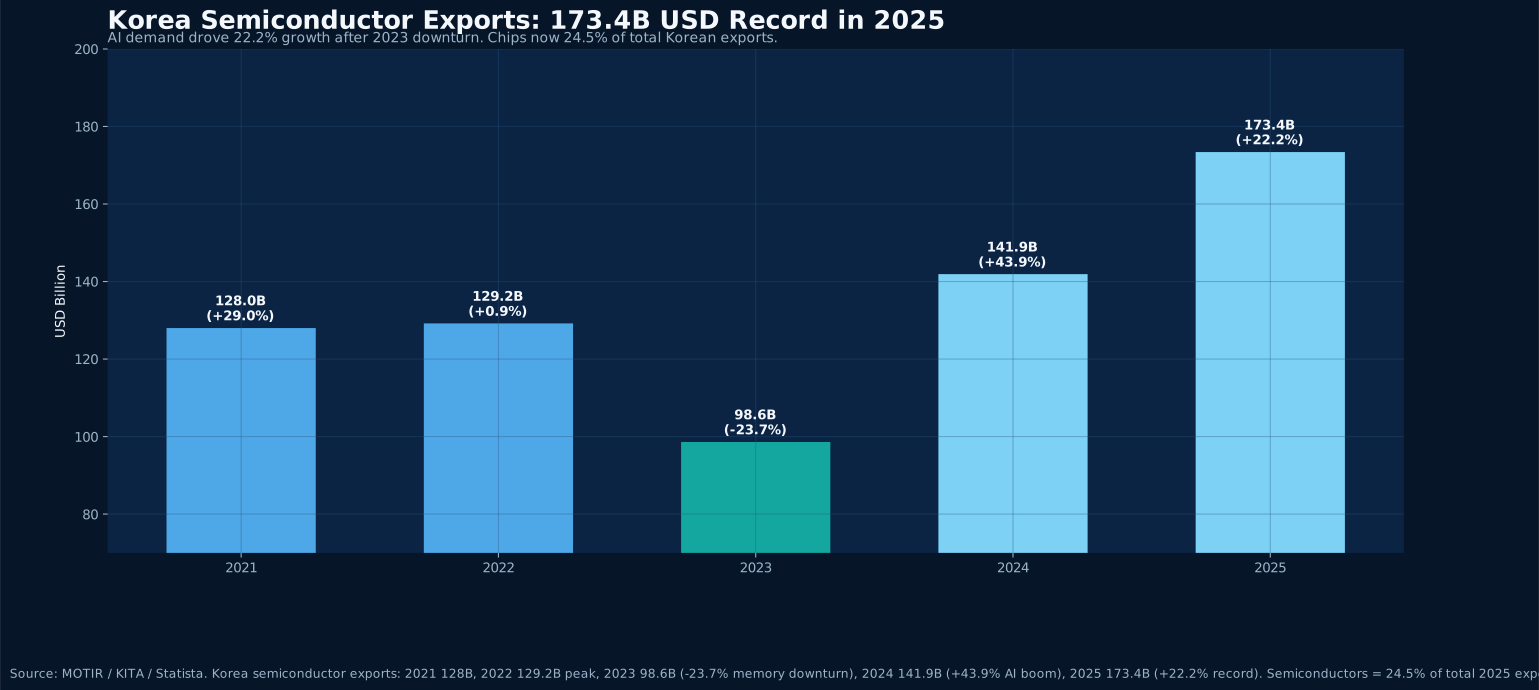
Korea's 2025 semiconductor exports reached $173.4B (+22.2%), accounting for 24.5% of total exports. China remains the #1 destination (32.8%), but export controls and supply chain shifts are reshaping the landscape.
Read Article
Textile & Apparel · 2026-04-08
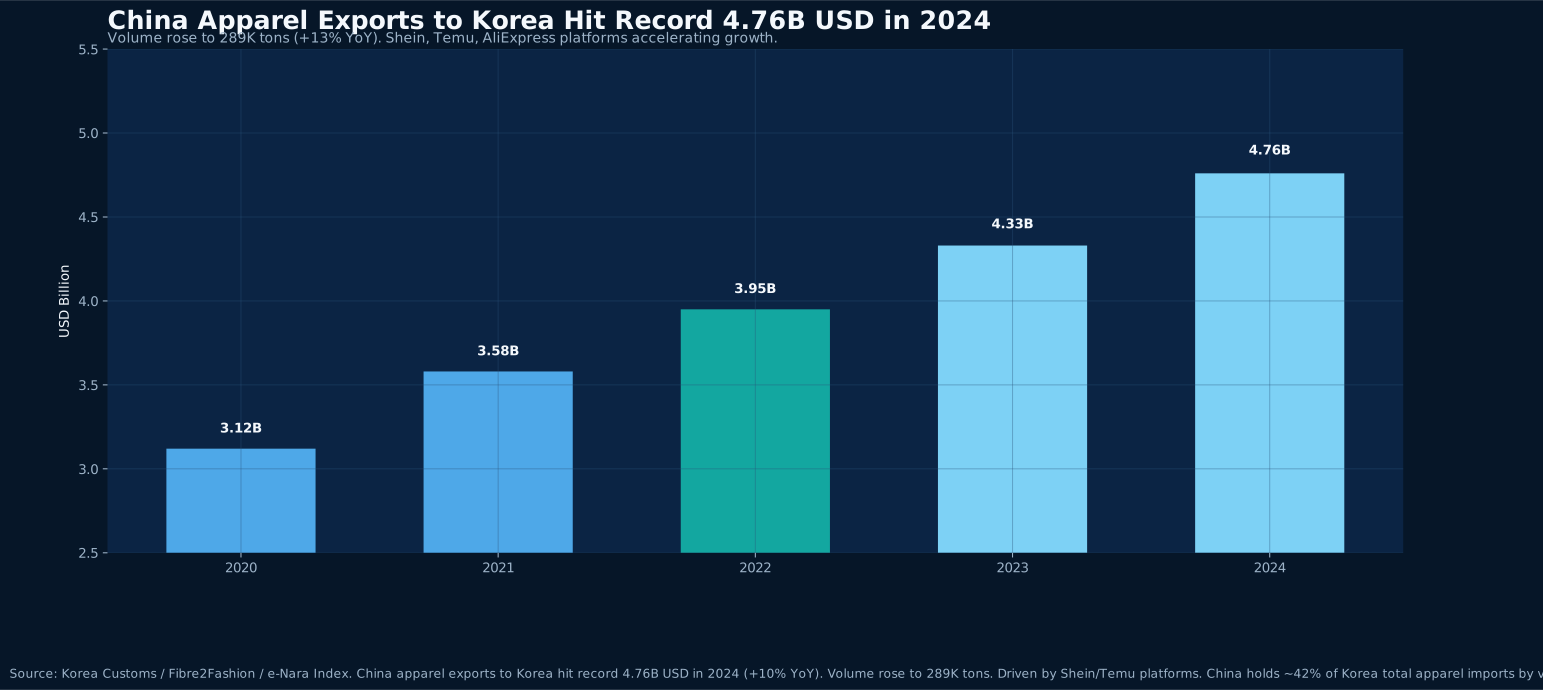
China's apparel exports to Korea hit a record $4.76B in 2024 (+10% YoY), while Korea's domestic textile production shrank from 28.5T KRW (2021) to 22.5T (2024). Temu's MAU surpassed 7.21 million, disrupting Korea's fashion retail landscape.
Read Article
Medical Devices · 2026-04-08
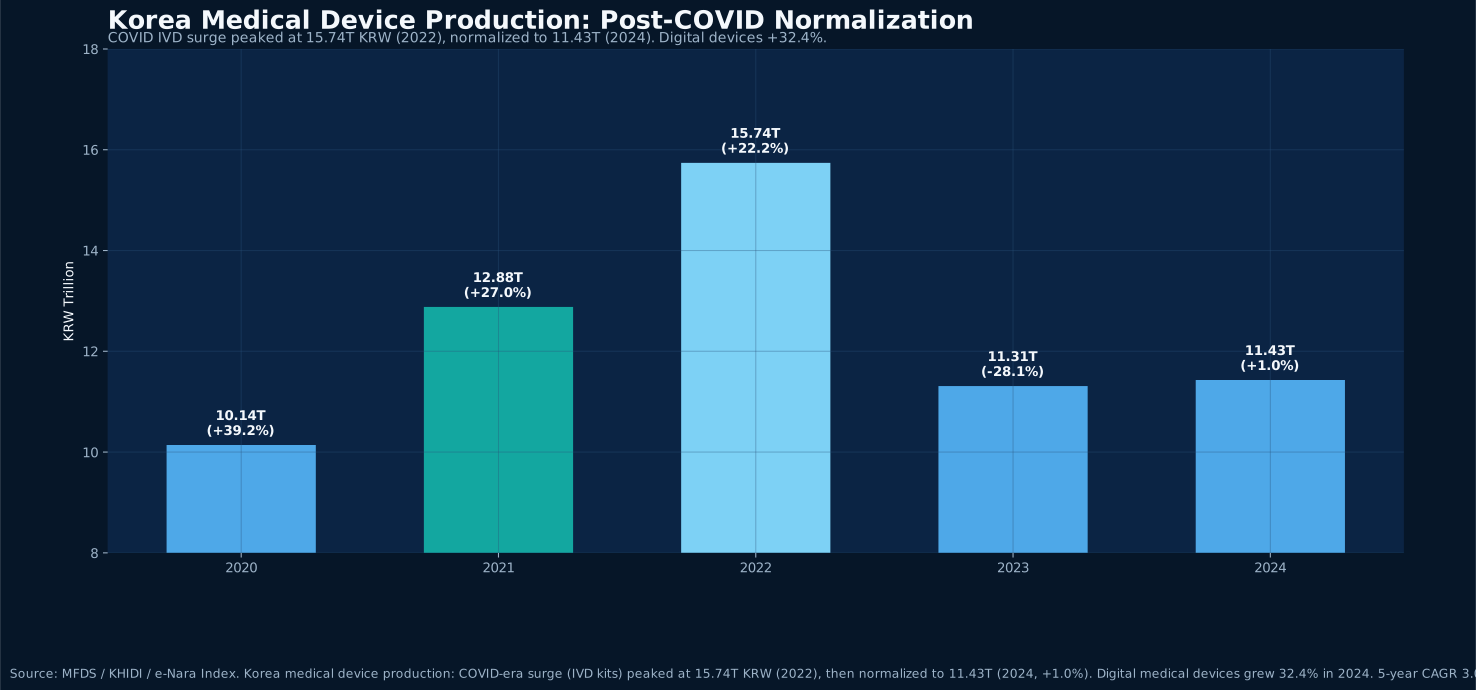
Korea's 2024 medical device production reached 11.43T KRW with exports at $5.26B. As COVID tailwinds fade, digital medical devices emerge as the new growth engine (+32.4%). China is Korea's #2 export market ($640M), led by implants and ultrasound.
Read Article
Steel Trade · 2026-04-08
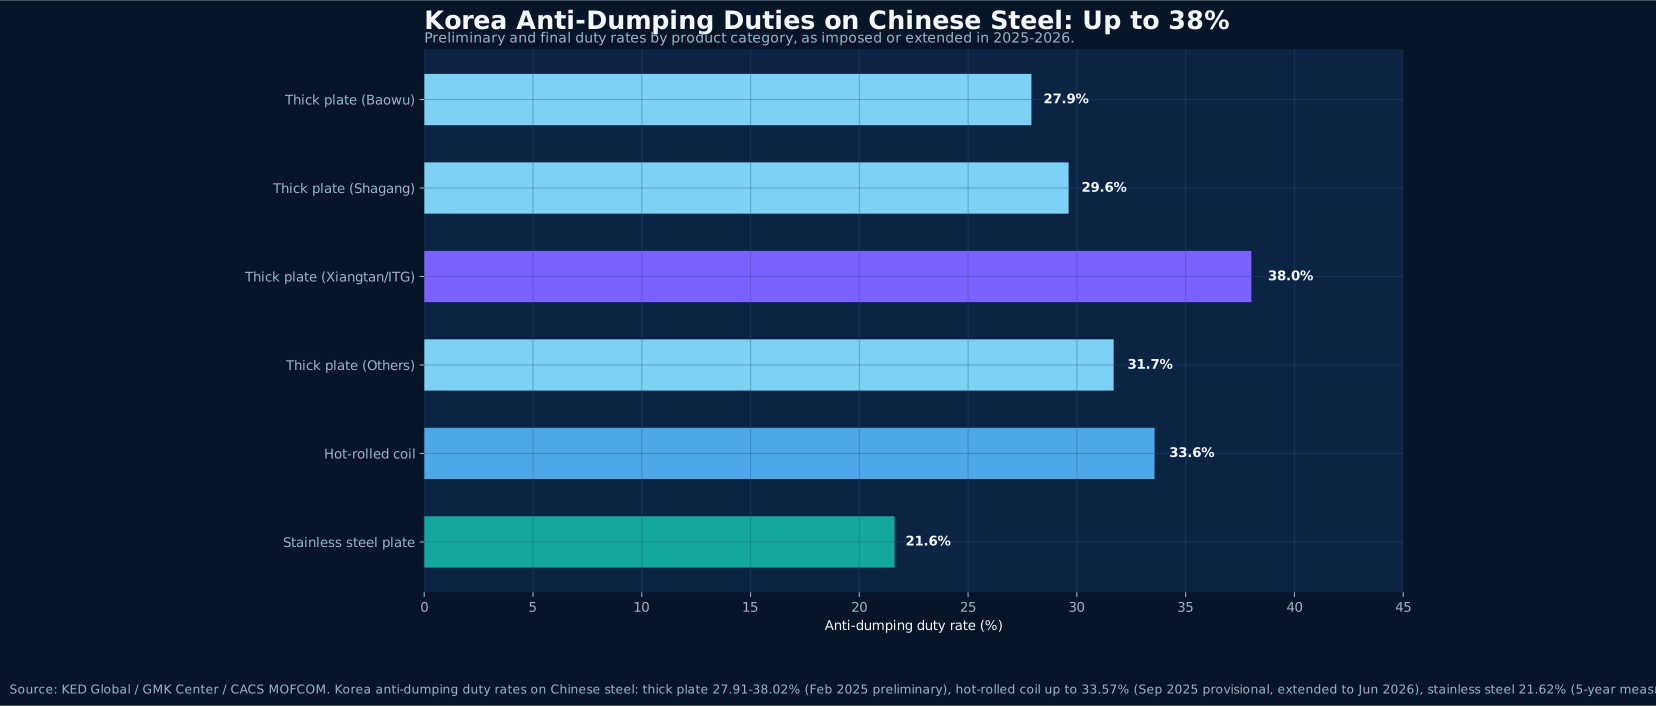
Between 2025 and 2026, Korea expanded anti-dumping measures on Chinese steel from heavy plate to hot-rolled coil and stainless steel, with duties up to 38.02%. Yet Chinese steel shipments to Korea keep rising — a paradox that reveals structural shifts.
Read Article
Beauty Regulation · 2026-04-08
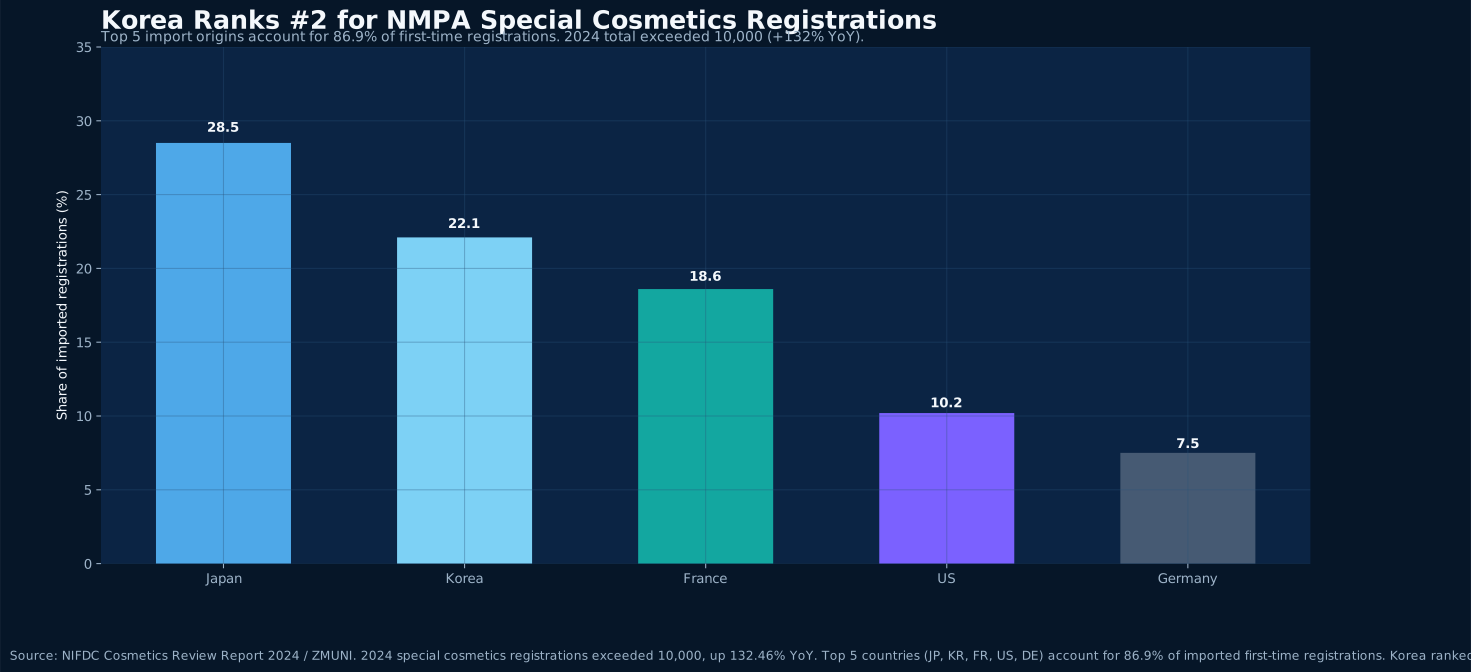
From February 2026, China launched a cosmetics e-labeling pilot in six major cities while NMPA continues to reform its registration system. Special cosmetics registrations exceeded 10,000 in 2024, up 132% YoY. Korea, as the second-largest import source, faces both opportunity and compliance complexity.
Read Article
Clean Energy Trade · 2026-04-08
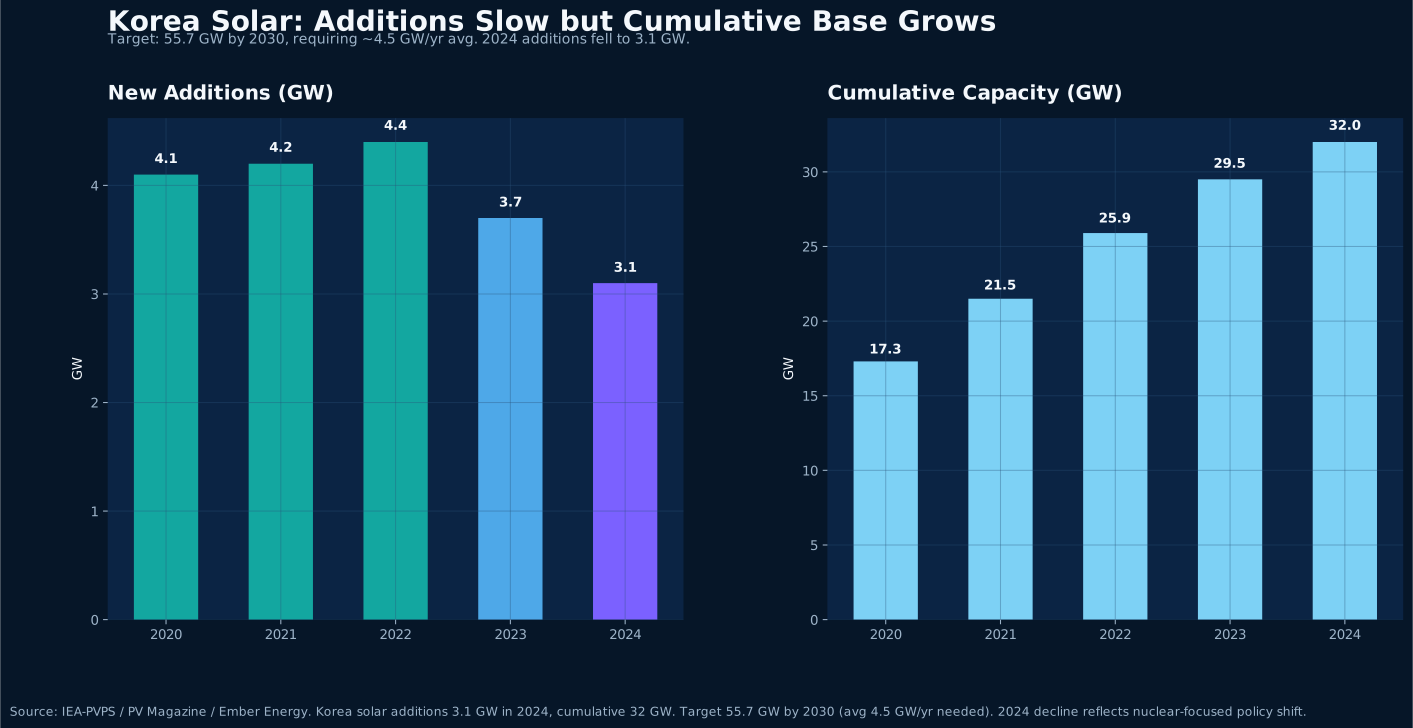
Korea’s cumulative solar capacity has reached 32 GW, but 2024 additions dropped to 3.1 GW, leaving a significant gap to the 2030 target of 55.7 GW. Meanwhile, China commands 93–98% of upstream PV supply. The tension between Korea’s clean energy goals and supply chain security is rising.
Read Article
Channel Insight · 2026-04-08
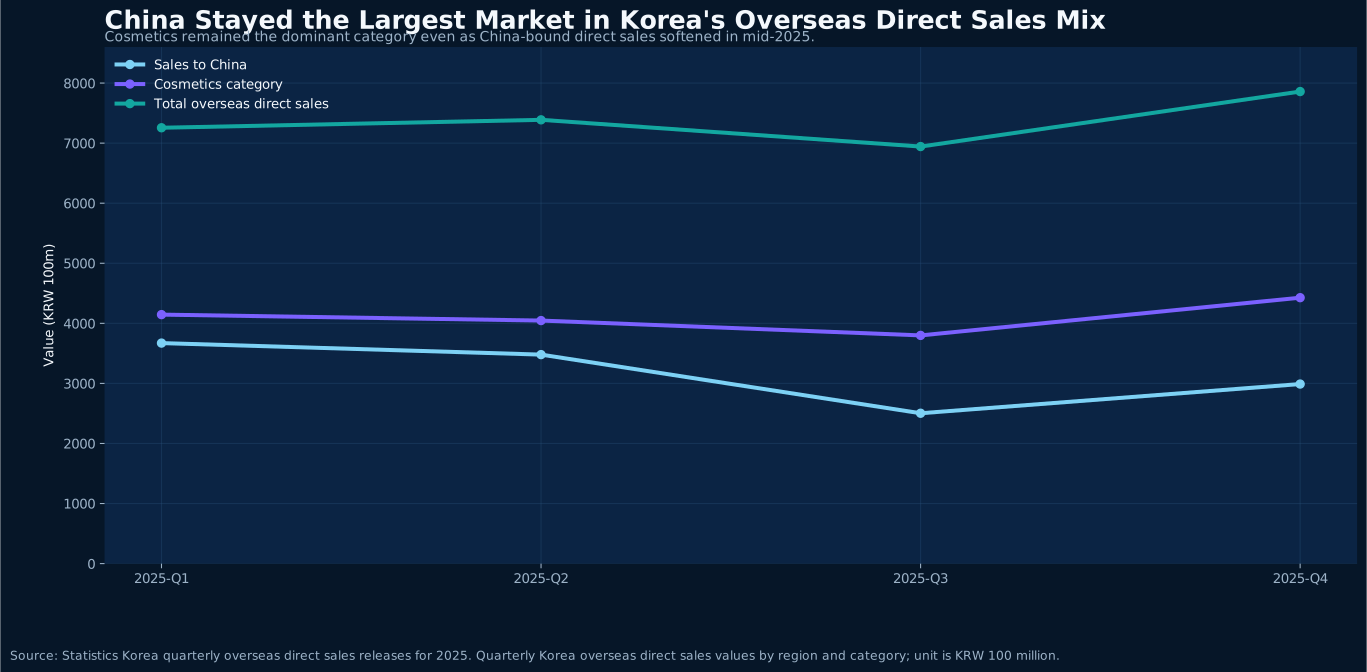
Statistics Korea shows Korea's overseas direct sales rose to KRW 785.9 billion in Q4 2025, yet sales to China fell to KRW 298.9 billion, clearly below the level seen earlier in the year. Cosmetics remained the largest category, but the real shift is that traffic and fulfillment are moving away from one-market dependence toward a lighter multi-market channel structure.
Read Article
Cosmetics & Functional Products · 2026-04-07
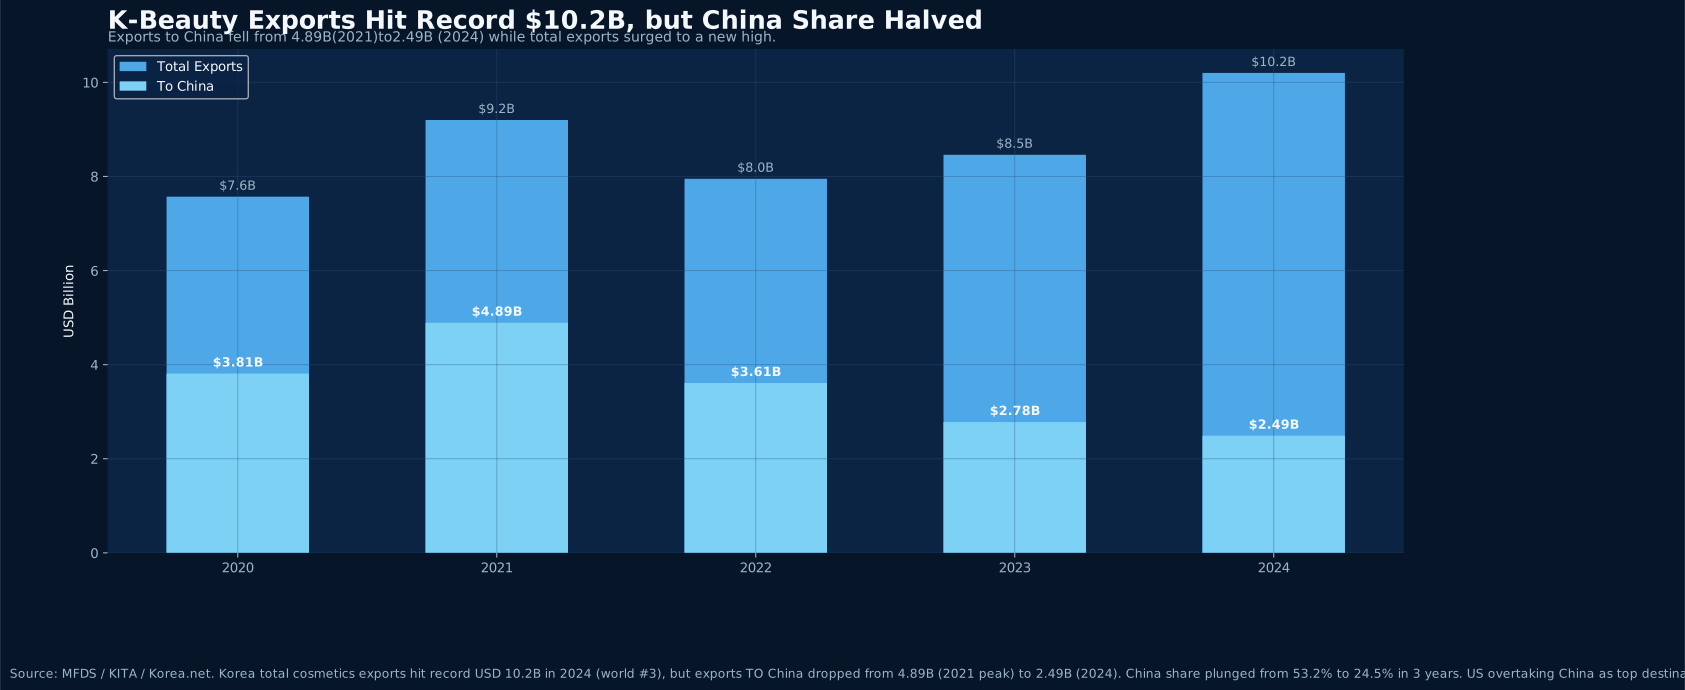
Korea's cosmetics exports hit a record USD 10.2B in 2024, but China-bound exports halved from $4.89B (2021) to $2.49B. Meanwhile, functional cosmetics production surged 35.2% to KRW 7.35 trillion. We analyze K-Beauty's market diversification logic and the functional upgrade trend.
Read Article
Cross-Border E-Commerce · 2026-04-07
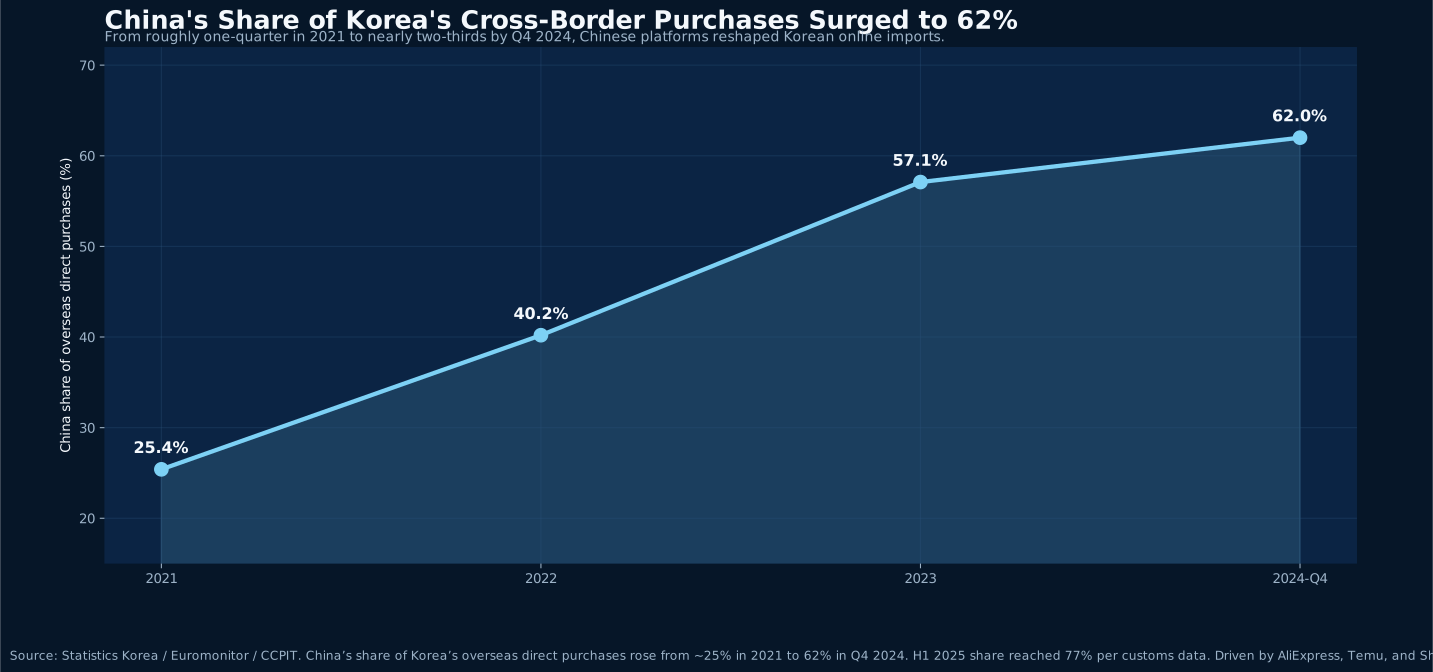
China’s share of Korea’s overseas direct purchases surged from 25% in 2021 to 62% in Q4 2024, reaching 77% in H1 2025. Temu’s global cross-border share jumped from 1% to 24% in three years, matching Amazon. We analyze the structural rise and its supply-chain implications.
Read Article
Critical Minerals & Supply Chain · 2026-04-07
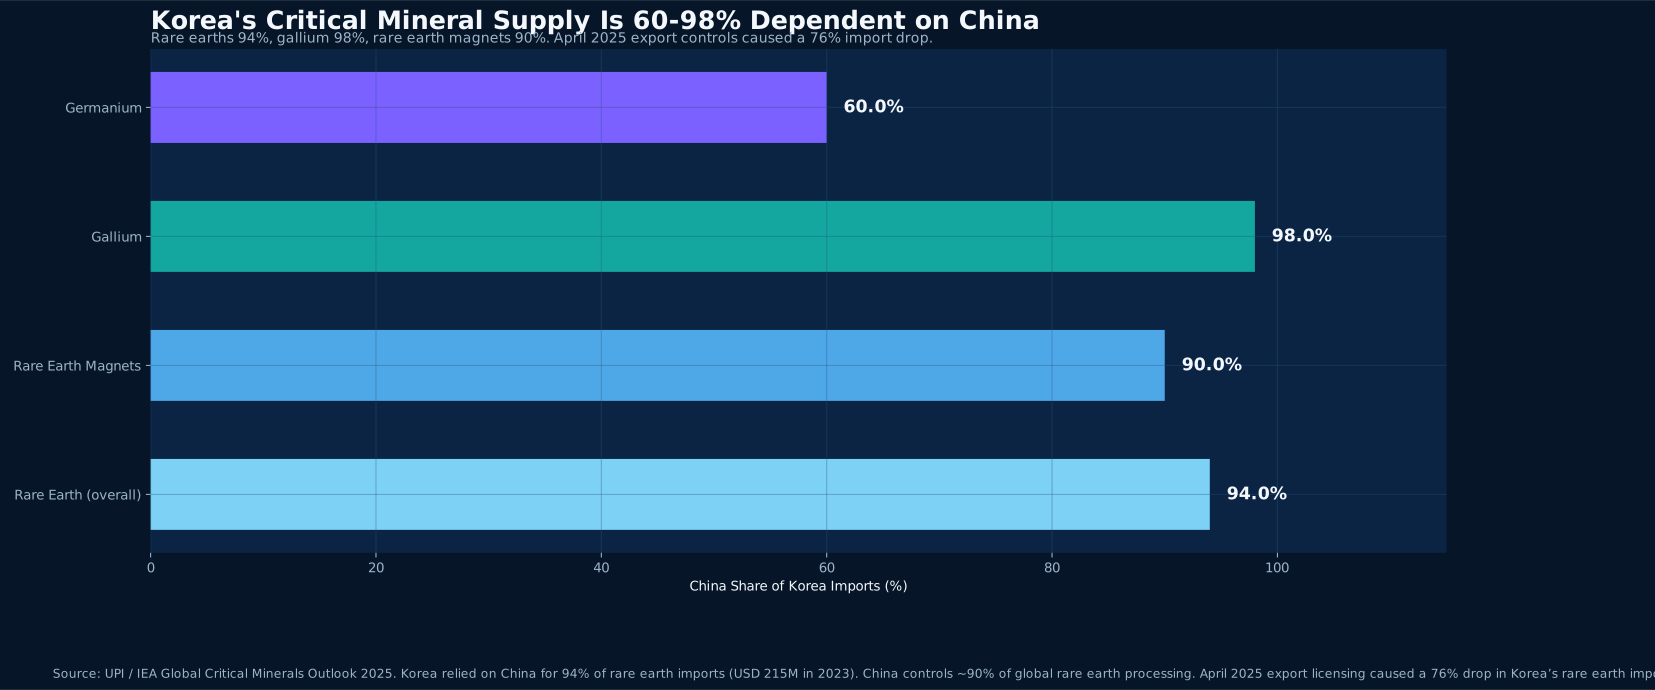
After China tightened rare earth export licensing in April 2025, Korea’s rare earth imports dropped 76%. Korea relies on China for 94% of its rare earths ($215M in 2023), while China controls 90% of global processing. We analyze the deep impact on Korean manufacturing, defense supply chains, and strategic responses.
Read Article
Certification & Compliance · 2026-04-06
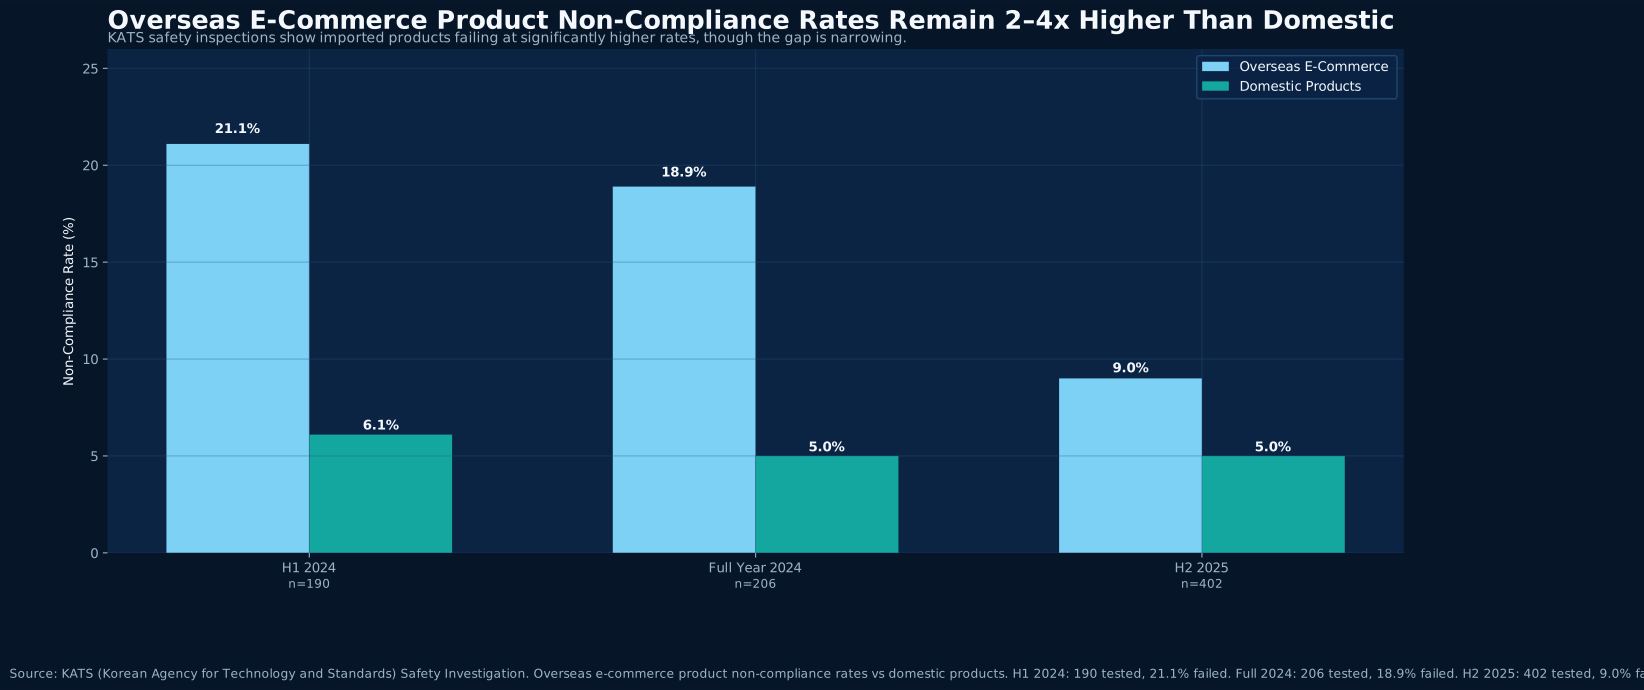
With overseas e-commerce product non-compliance rates 3-4x higher than domestic products and 2,537 total recalls in 2024, Korea is extending KC certification enforcement to online platforms. For Chinese exporters, this is both a challenge and an opportunity.
Read Article
Food & Agriculture · 2026-04-06
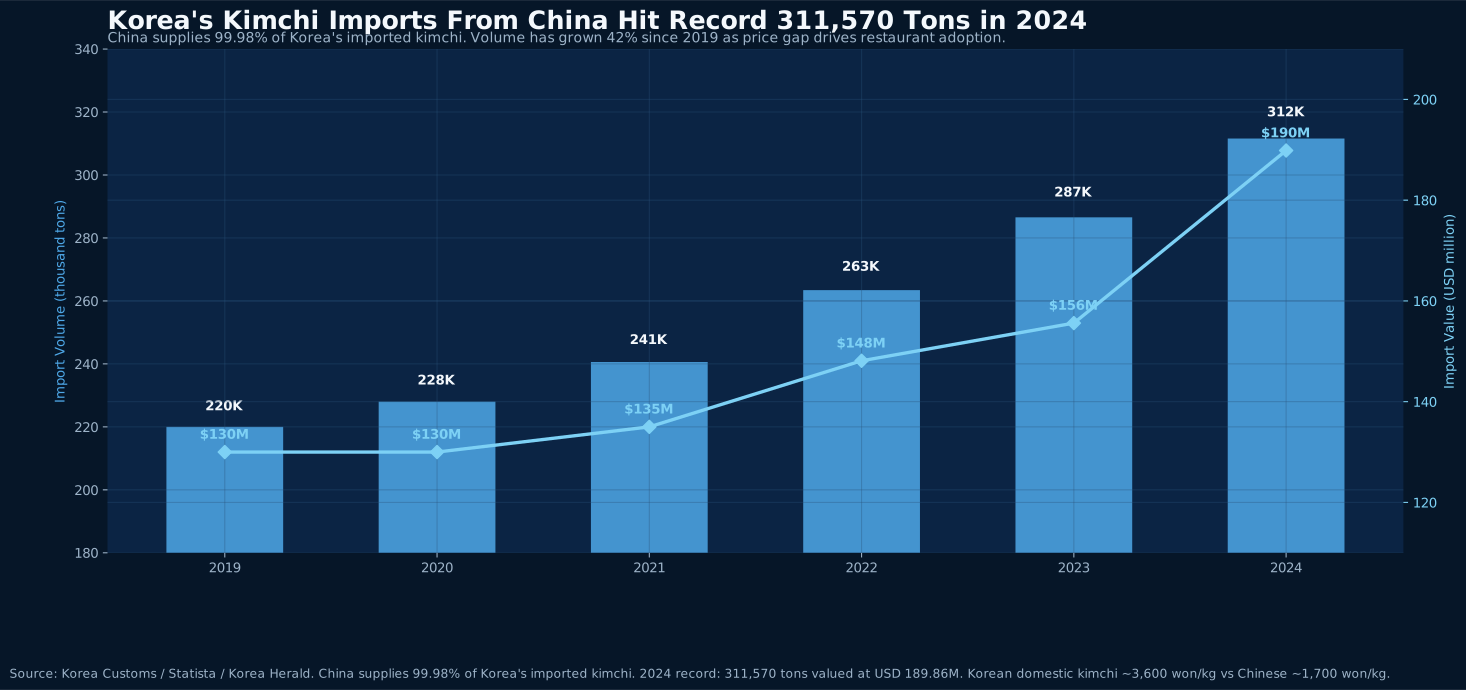
China supplies 99.98% of Korea's imported kimchi and ranks first in total food import volume. Yet 42.4% of 2024's 1,454 import food non-compliance cases involved Chinese products. Between a growing market and tightening regulations, understanding both structure and risk is essential.
Read Article
Trade Trend Insight · 2026-04-05
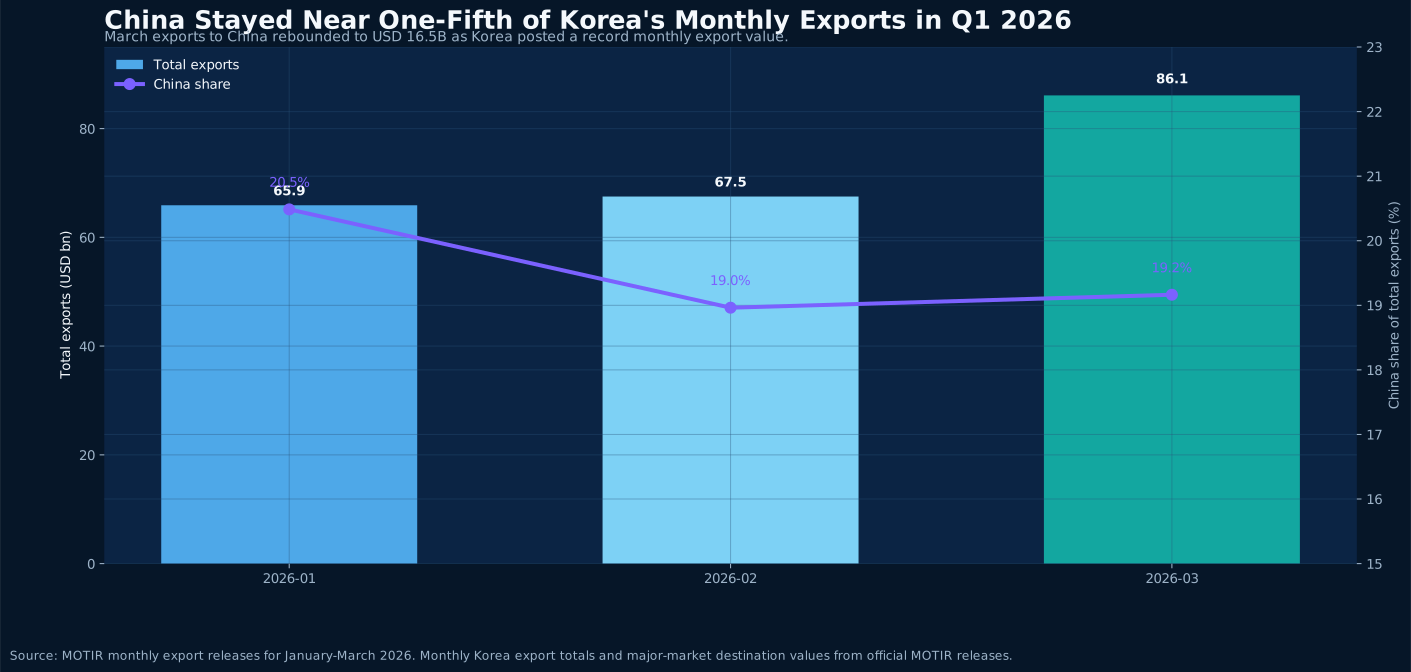
Official Korean export releases for January through March 2026 show exports to China moving from USD 13.5 billion in January and 12.8 billion in February to 16.5 billion in March. The bigger story is not the rebound alone, but the way semiconductors, computers, and consumer goods together put China back near the center of Korea's export structure.
Read Article
Cross-Border Ecommerce Insight · 2026-04-05
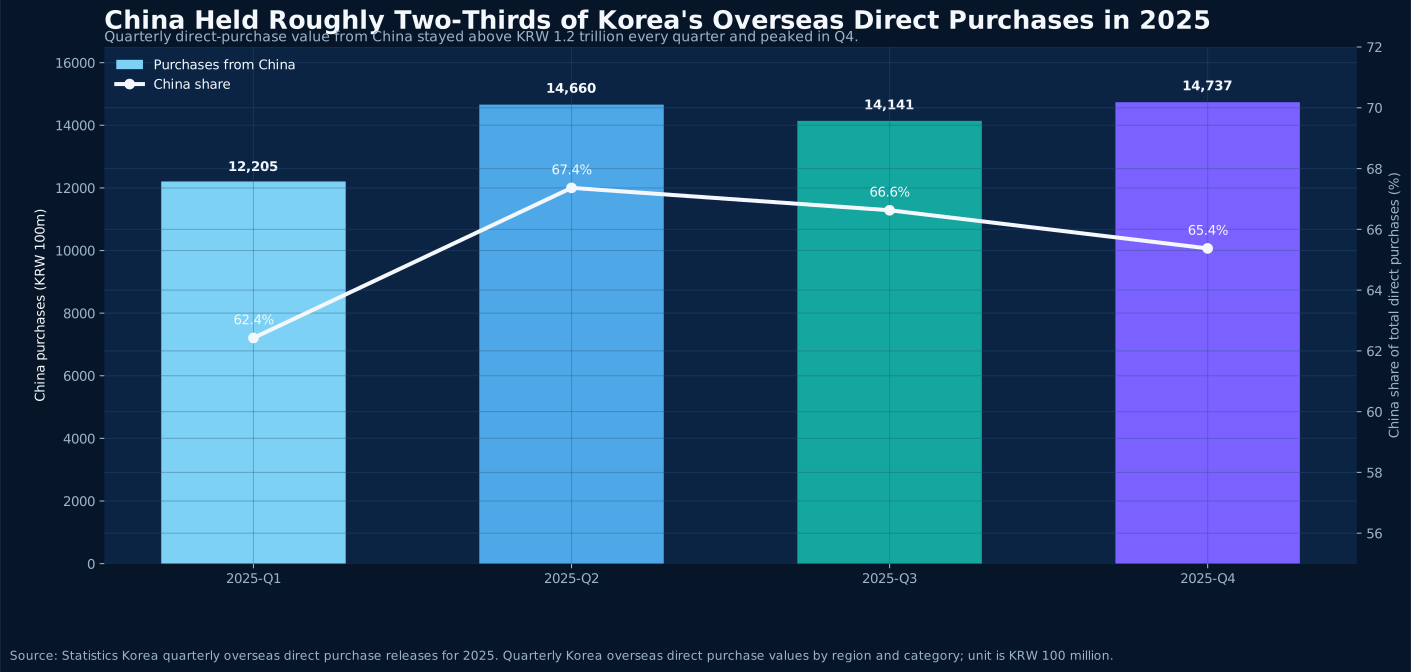
Across all four quarters of 2025, Statistics Korea shows China remaining Korea's largest source of overseas direct purchases, climbing from KRW 1.2205 trillion in Q1 to KRW 1.4737 trillion in Q4. The more important signal is the stability of China's supply position across fashion, food, and daily-use categories.
Read Article
Beauty Export Insight · 2026-04-05
Statistics Korea's 2025 overseas direct-sales data kept China in the No.1 position across all four quarters, while Korean authorities simultaneously rolled out ecommerce HS-code support and new K-beauty export initiatives. For packaging, filling, warehousing, and brand-service operators, the real shift is that channel speed and compliance are now moving forward together.
Read Article
Policy & Trade Insight · 2026-04-05
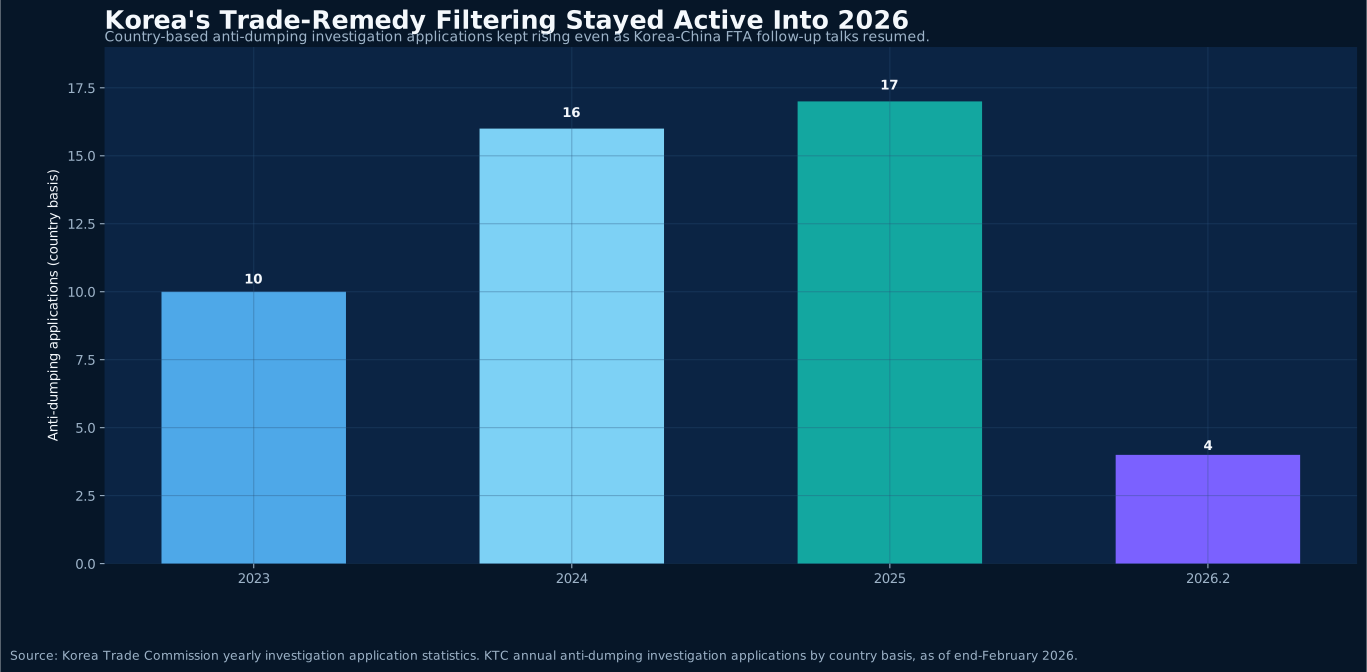
When firms hear that Korea and China are accelerating follow-up talks on FTA services and investment, they often assume the market is becoming easier again. The public signal from Korea says something more precise: institutional upgrading and dialogue are returning, while anti-dumping, circumvention control, and enforcement are moving further forward at the same time. The opportunity is not a looser market, but a clearer threshold for how business must be done.
Read Article
Glass Insight · 2026-04-04
Trade pressure on standard float glass from China has not erased Korean demand. What is changing is the buying mix, with tempered, Low-E, insulated, and other processed categories becoming more important.
Read Article