Energy Storage · 2026-08-10
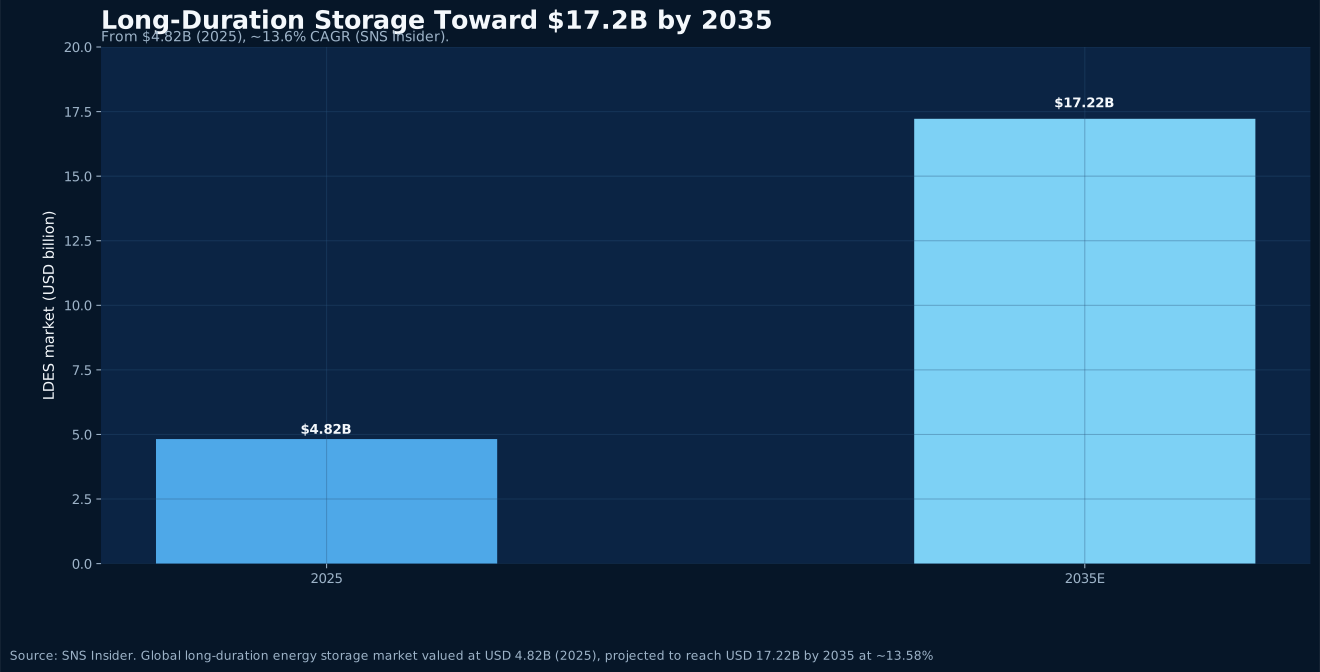
As wind and solar become the grid's backbone, storing surplus daytime and windy-hour power for the night and calm spells has become a key bottleneck. Per SNS Insider, the global long-duration energy storage market will grow from $4.82B (2025) to $17.22B (2035) at ~13.6% CAGR. Meanwhile, Form Energy's iron-air batteries have landed a 12 GWh deal with Crusoe for AI data centers — LDES is moving from policy concept to real orders.
Read Article
Autonomous Driving · 2026-08-10
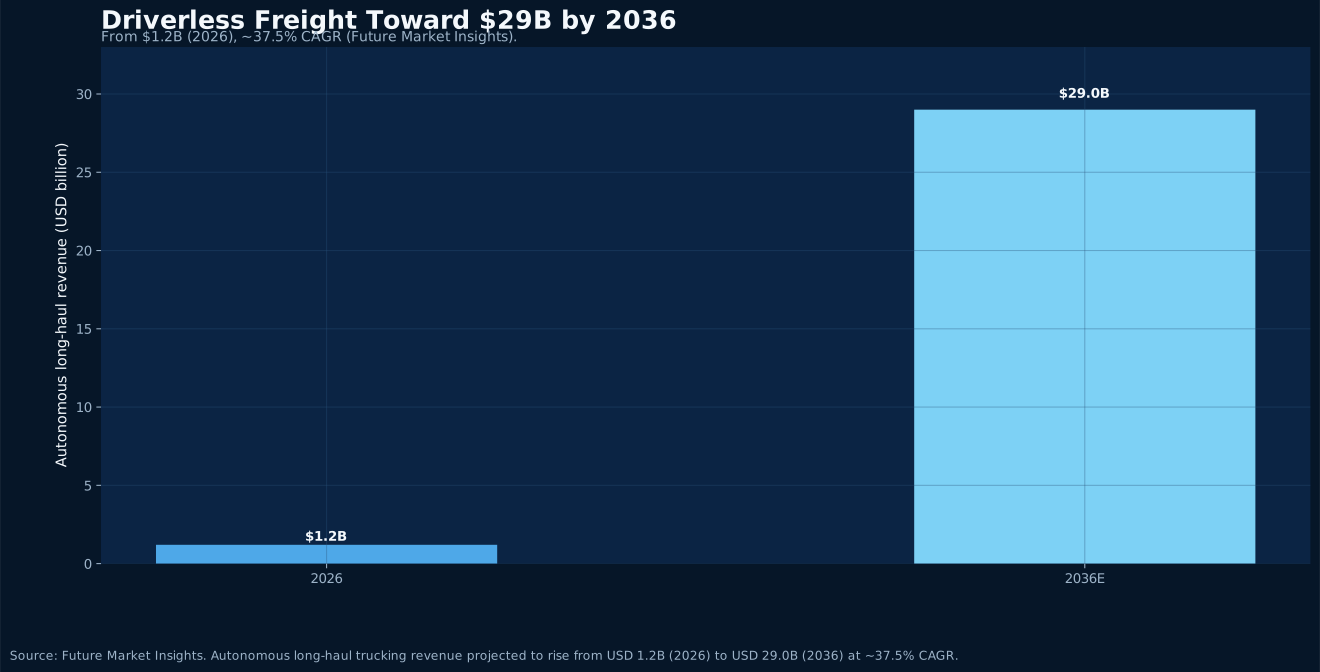
Autonomous trucks are crossing the line between demonstration and operations. Per Future Market Insights, global autonomous long-haul freight revenue will grow from $1.2B (2026) to $29.0B (2036) at ~37.5% CAGR. Frontrunner Aurora pushed its collision-free driverless mileage from 100,000 to about 440,000 miles in the first half of 2026 — commercialization is turning from vision into reality.
Read Article
Cybersecurity · 2026-08-10
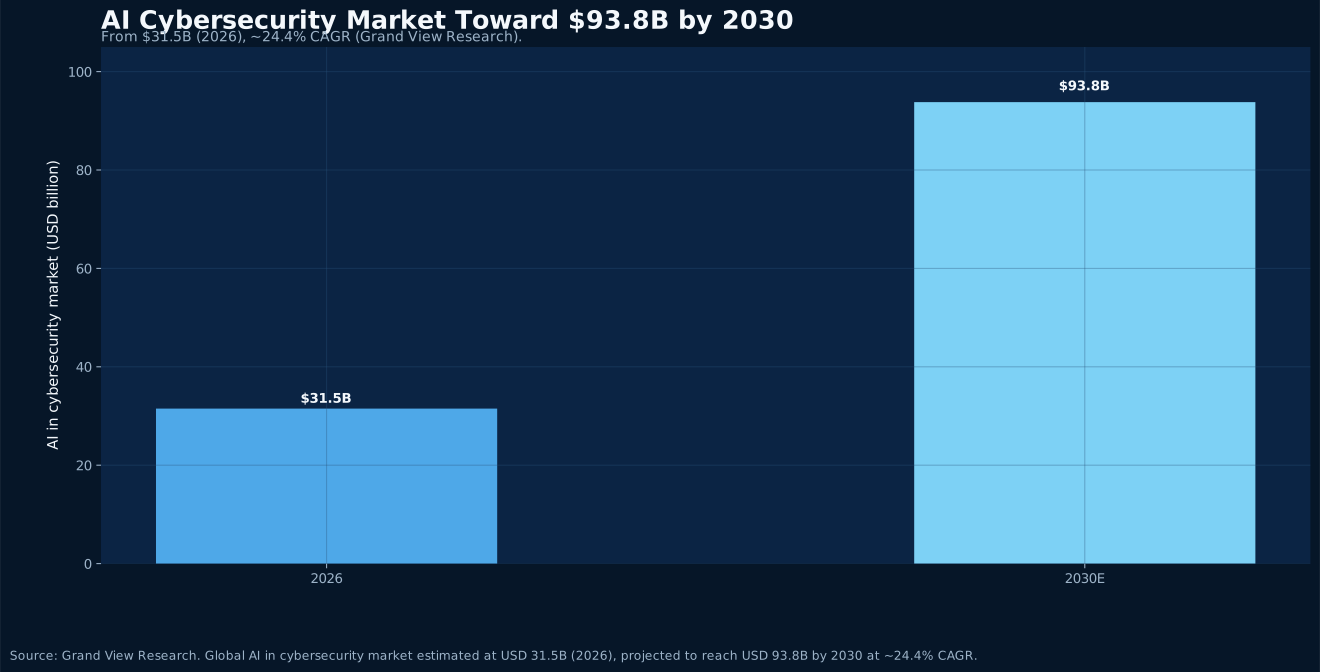
AI is reshaping both the attack and defense sides of cybersecurity at once. Per Grand View Research, the global AI-in-cybersecurity market will grow from $31.5B (2026) to $93.8B (2030) at ~24.4% CAGR. IBM's 2025 Cost of a Data Breach report shows firms extensively deploying AI and automation averaged $3.62M per breach — about $1.9M less than those without AI. AI is both a new source of risk and the most effective tool of defense.
Read Article
Advanced Packaging · 2026-08-03
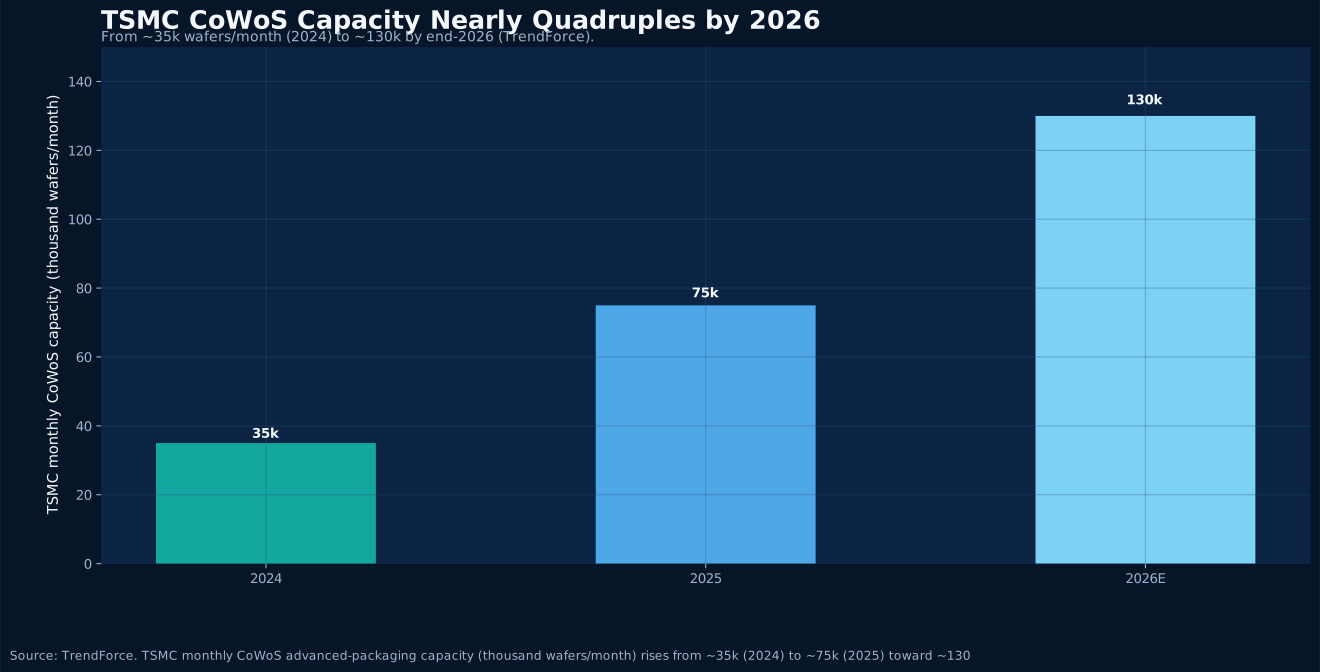
The compute race's bottleneck has shifted from the wafer node to back-end packaging. In 2026, TSMC's monthly CoWoS capacity is set to jump from ~35k wafers (2024) to ~130k, while the global chiplet market races from $51.9B (2025) toward $157.2B (2030). Advanced packaging is now the tightest — and most delivery-defining — link in the AI chip supply chain.
Read Article
Carbon Removal · 2026-08-03
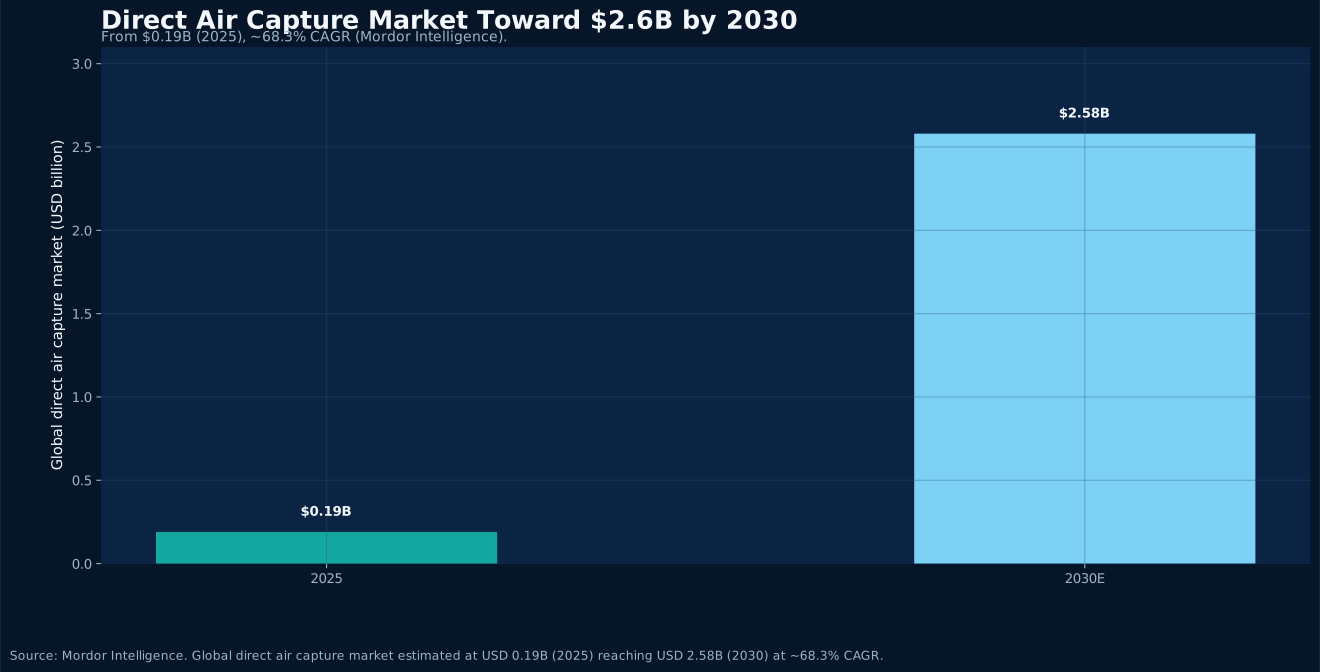
Carbon removal is moving from science experiment to industrial deployment. Per Mordor Intelligence, the global direct air capture (DAC) market will race from $0.19B (2025) toward $2.58B (2030) at a CAGR above 68%. And per the IEA, global CO₂ capture capacity could grow from ~50 Mt/yr operational in early 2024 to a ~430 Mt/yr project pipeline by 2030. The inflection toward scale is near.
Read Article
Obesity Drugs · 2026-08-03
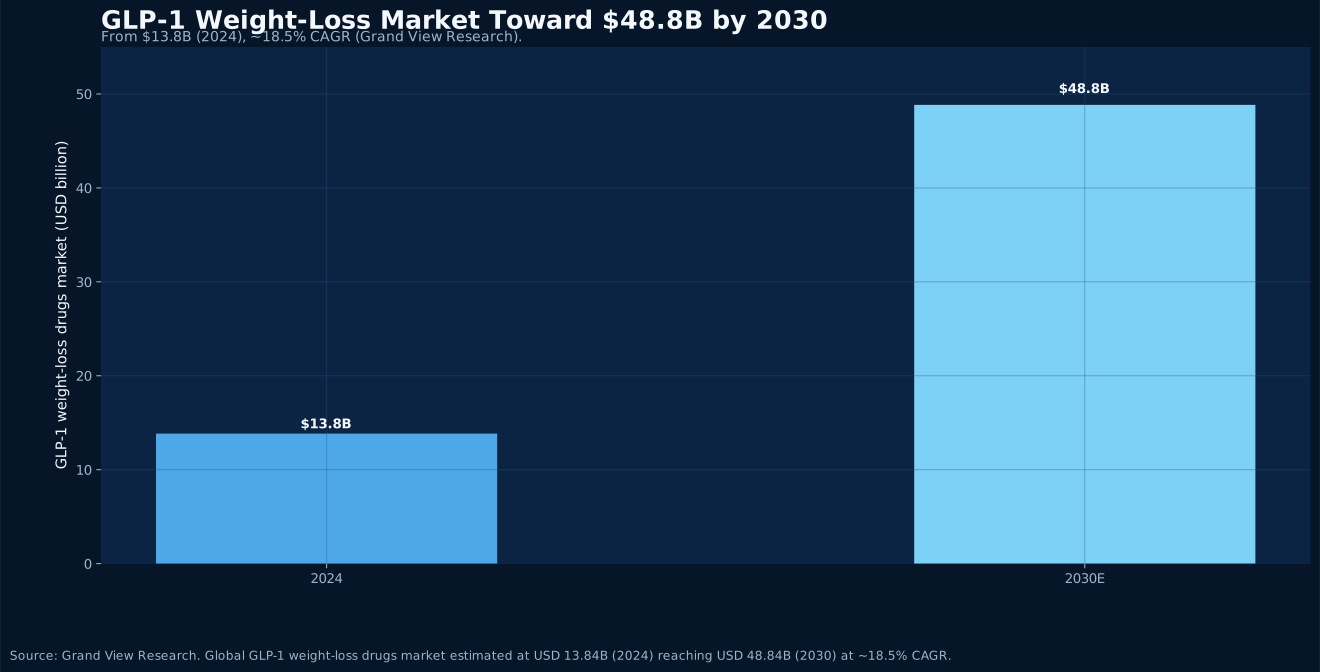
Weight-loss drugs have gone from a medical topic to an industrial-scale global phenomenon. Per Grand View Research, the global GLP-1 weight-loss drugs market will grow from $13.8B (2024) to $48.8B (2030) at ~18.5% CAGR. In 2025, Eli Lilly's cardiometabolic unit brought in ~$40B and Novo Nordisk's diabetes and obesity segment ~$44B — a duopoly race defined by manufacturing capacity.
Read Article
Advanced Air Mobility · 2026-07-27
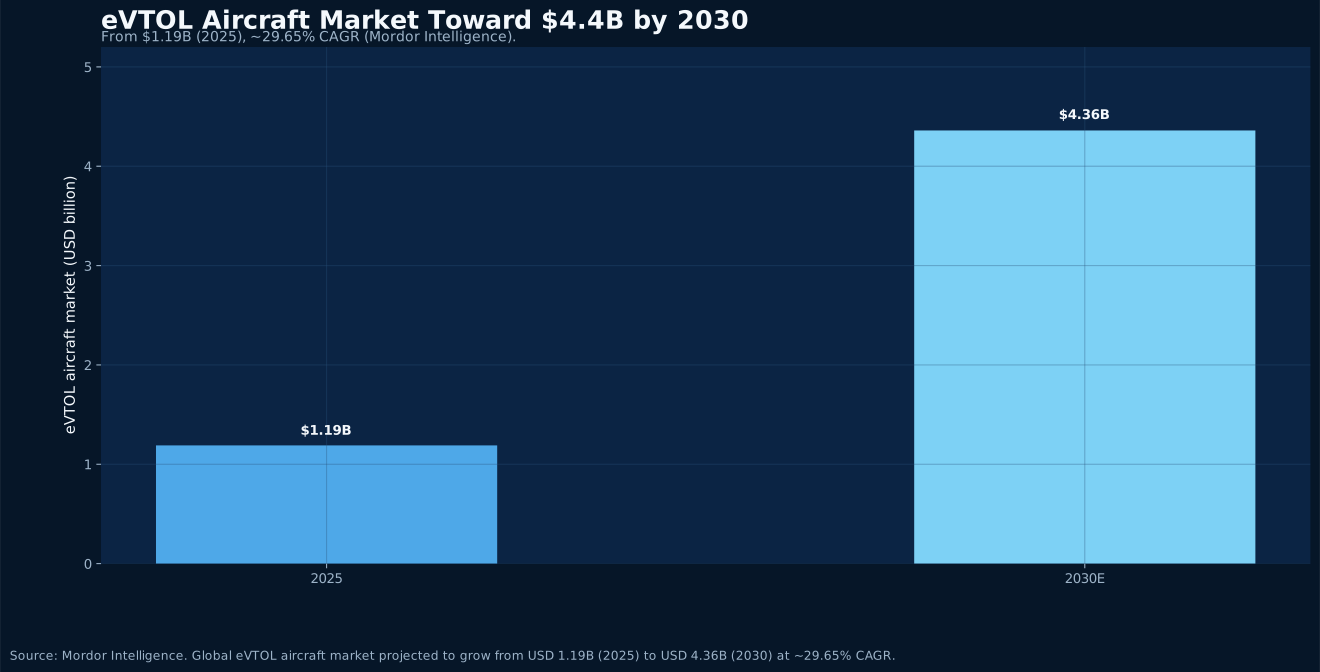
Air taxis are moving from concept to runway. In 2026, Joby completed Stage 4 of the FAA type-certification process, with its Type Certificate expected before year-end—making it the frontrunner for the first US commercial eVTOL operations, while Archer sits at Stage 3. Per Mordor Intelligence, the global eVTOL aircraft market is set to grow from ~$1.19B (2025) to ~$4.36B (2030) at ~29.65% CAGR, while the broader urban air mobility (UAM) market rises from $5.56B to $18.56B over the same span. The supply chain—motors, batteries, composites and flight control—is becoming a new arena for Chinese and Korean manufacturing.
Read Article
Power Semiconductors · 2026-07-27
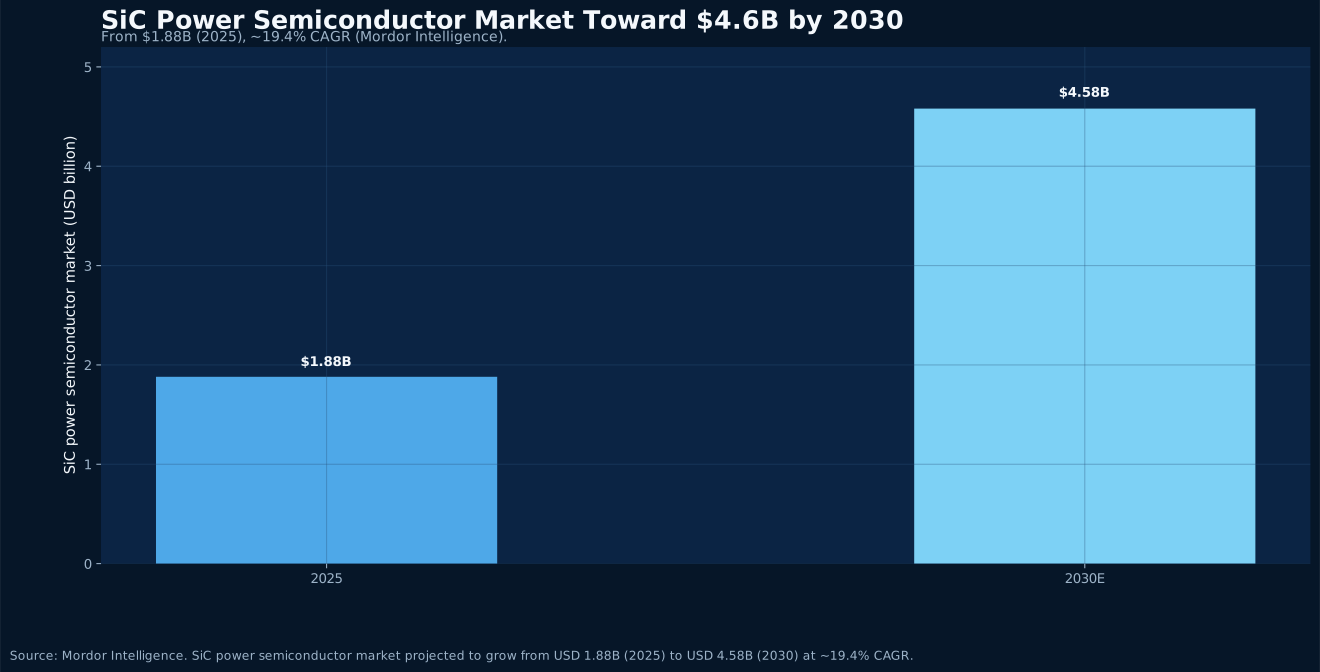
Silicon carbide (SiC) is shifting from a niche material to the default choice for EVs and the grid. Per Mordor Intelligence, the global SiC power semiconductor market is set to grow from ~$1.88B (2025) to ~$4.58B (2030) at ~19.4% CAGR; on the broader SiC-devices basis, Fortune Business Insights sees the market rising from ~$4.57B (2026) to ~$26.13B (2034). Automotive is the prime engine—about 62% of 2024 revenue—and as carmakers move to 800V platforms, SiC MOSFETs deliver 2-4% efficiency gains over silicon IGBTs. For the China-Korea supply chain, substrates, epitaxy and module packaging are the new value heights.
Read Article
Geothermal Energy · 2026-07-27
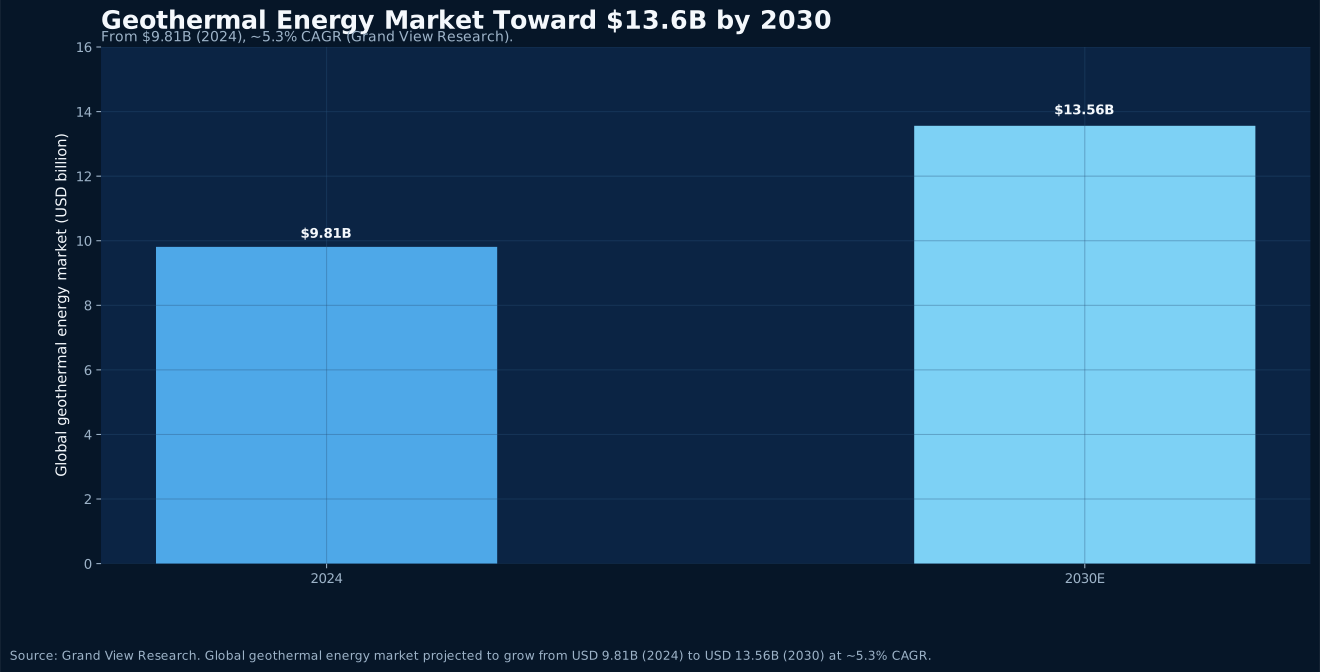
Enhanced geothermal systems (EGS) are crossing the 'valley of death.' In 2026, Fervo Energy secured a $421M non-recourse loan for its flagship Cape Station project in Utah and prepared a clean-energy IPO of up to ~$1.33B—one of 2026's largest. More decisively, on the demand side, Fervo signed a framework agreement with Google to support up to 3 gigawatts (GW) of geothermal capacity through 2033, with Cape Station's initial 100 MW grid connection expected in 2026. The broader geothermal market is more modest—per Grand View Research it grows from ~$9.81B (2024) to ~$13.56B (2030). The real variable is AI data centers' thirst for round-the-clock clean power.
Read Article
AI Silicon · 2026-07-20
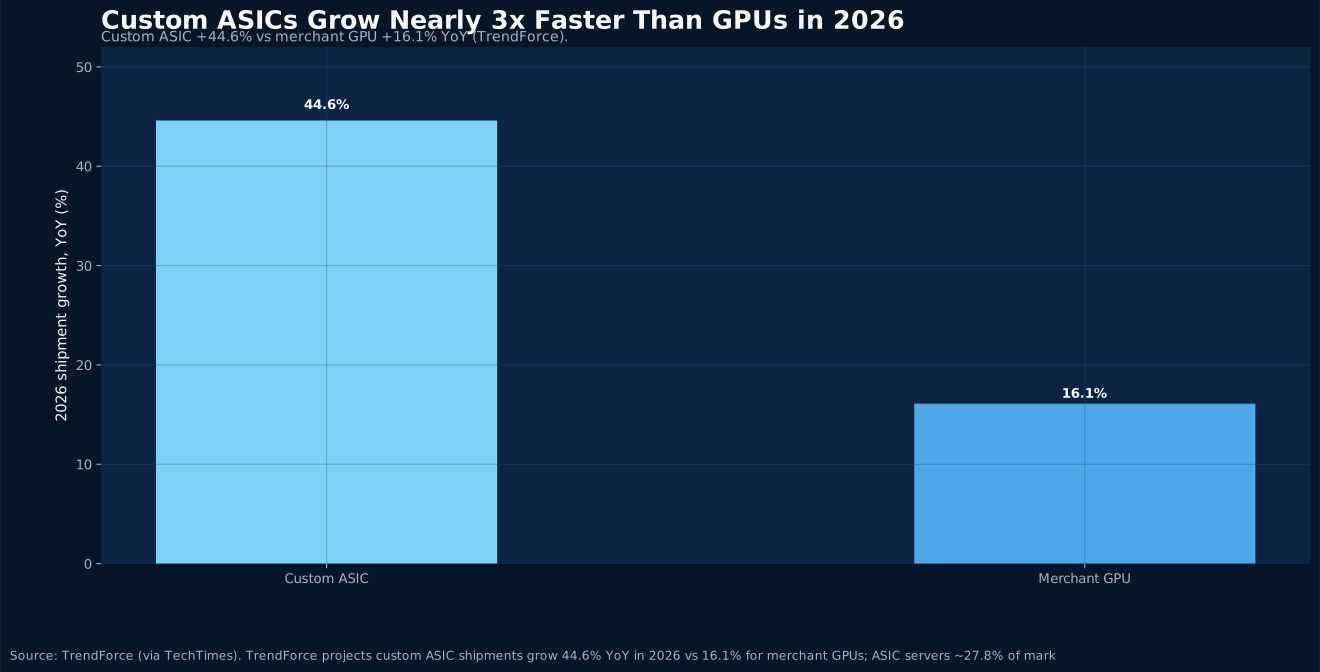
The competitive landscape of AI compute is being rewritten. TrendForce projects custom ASIC shipments will grow 44.6% year over year in 2026—nearly triple the 16.1% growth of merchant GPUs. A wave of custom silicon led by Broadcom, Google and Marvell is pushing hyperscalers from Nvidia-only toward diversified in-house designs. Bloomberg Intelligence expects the overall AI accelerator market to expand from $116B in 2024 to $604B by 2033. For MO-TEK and its supply-chain clients, this reshapes demand across servers, cooling and connectors.
Read Article
Energy Storage · 2026-07-20
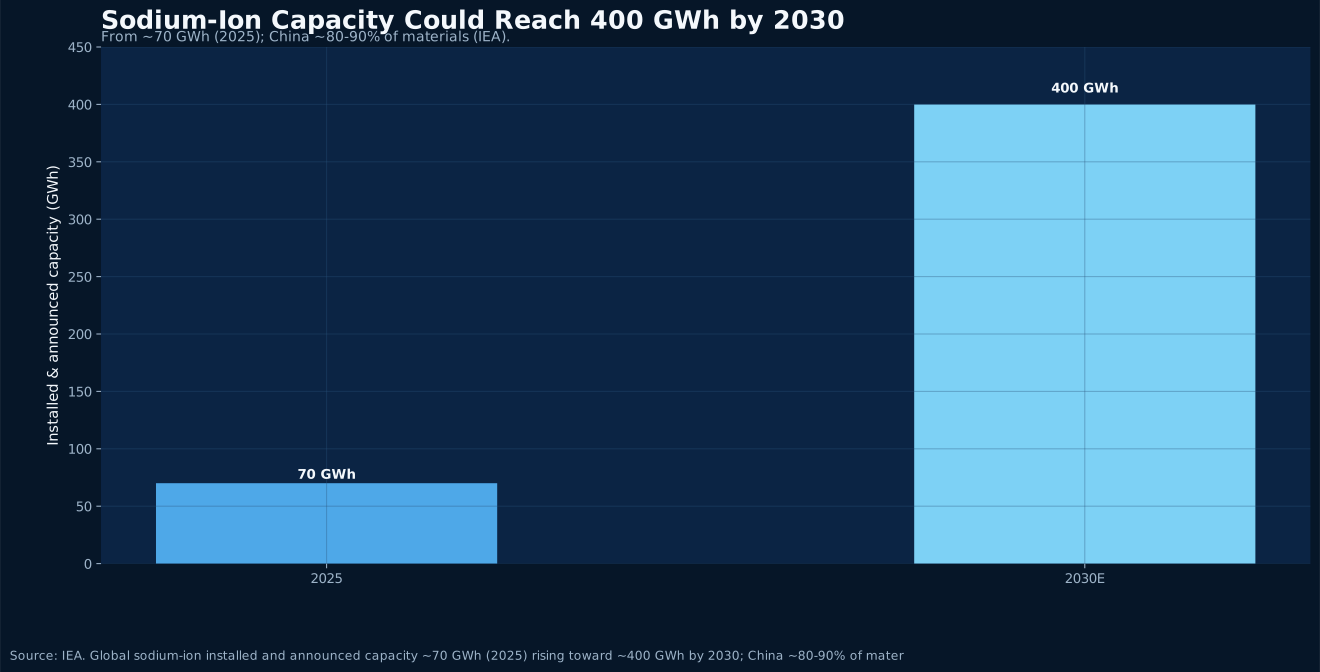
Long dismissed as a lab technology, sodium-ion batteries are crossing the threshold into mass production in 2026. Per the IEA, global installed and announced sodium-ion capacity could jump from about 70 GWh in 2025 to roughly 400 GWh by 2030; MarketsandMarkets projects the market will grow from $0.67B in 2025 to $2.01B by 2030, a ~24.7% CAGR. Mass-production plans from CATL and BYD are pushing this low-cost, high-safety, cold-tolerant chemistry into energy storage and entry-level EVs.
Read Article
Solar PV · 2026-07-20
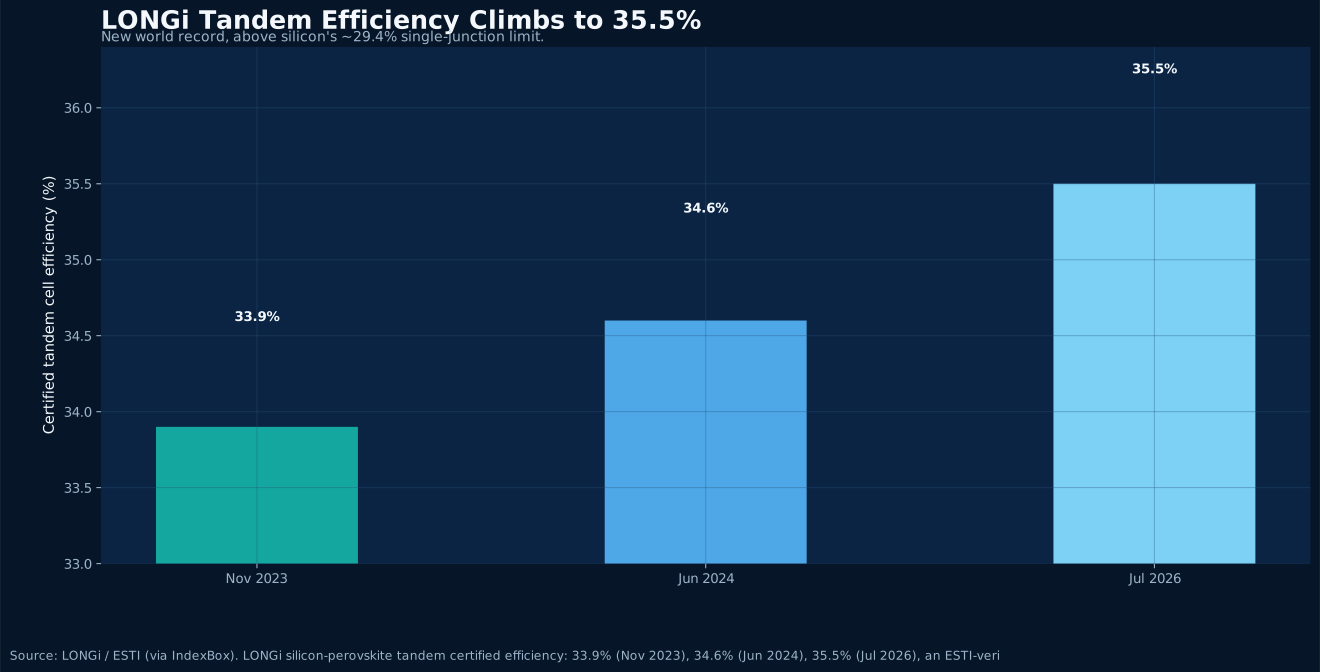
The race in solar efficiency is rewriting the ceiling. In July 2026, LONGi announced its crystalline-silicon/perovskite tandem cell reached 35.5%, certified by the European Solar Test Installation (ESTI)—another world record, already well beyond single-junction silicon's ~29.4% theoretical limit. Meanwhile, perovskite is moving from lab to production: Oxford PV has shipped commercial modules. Per a forecast cited by GlobeNewswire, the global perovskite solar market could grow from about $1.94B in 2025 to roughly $24.19B by 2035, a ~28.7% CAGR.
Read Article
Fintech · 2026-07-13
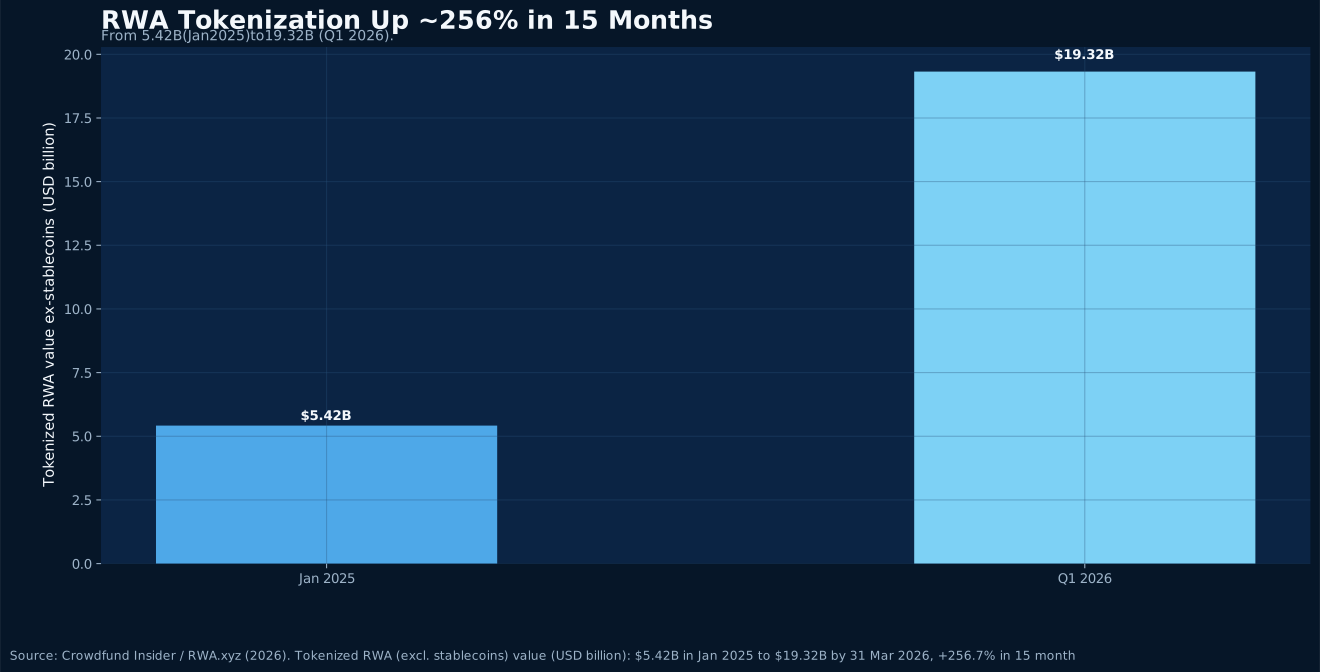
In 2026, on-chain finance is seeing two storylines surge in parallel. Total stablecoin market cap set an all-time high of about $320B in May, with supply holding above $313B and holders topping 241 million; Tether (USDT) accounts for ~$184.7B (~59%) and USDC ~$73.8B (~24%). Meanwhile, tokenized real-world assets (RWA) excluding stablecoins jumped from $5.42B in January 2025 to $19.32B by the first quarter of 2026, up about 256.7% in fifteen months. On-chain dollars and real assets are becoming twin engines, migrating traditional finance's balance sheet onto the blockchain. For cross-border trade and settlement, it signals a faster, more transparent, programmable money rail taking shape.
Read Article
Neurotech · 2026-07-13
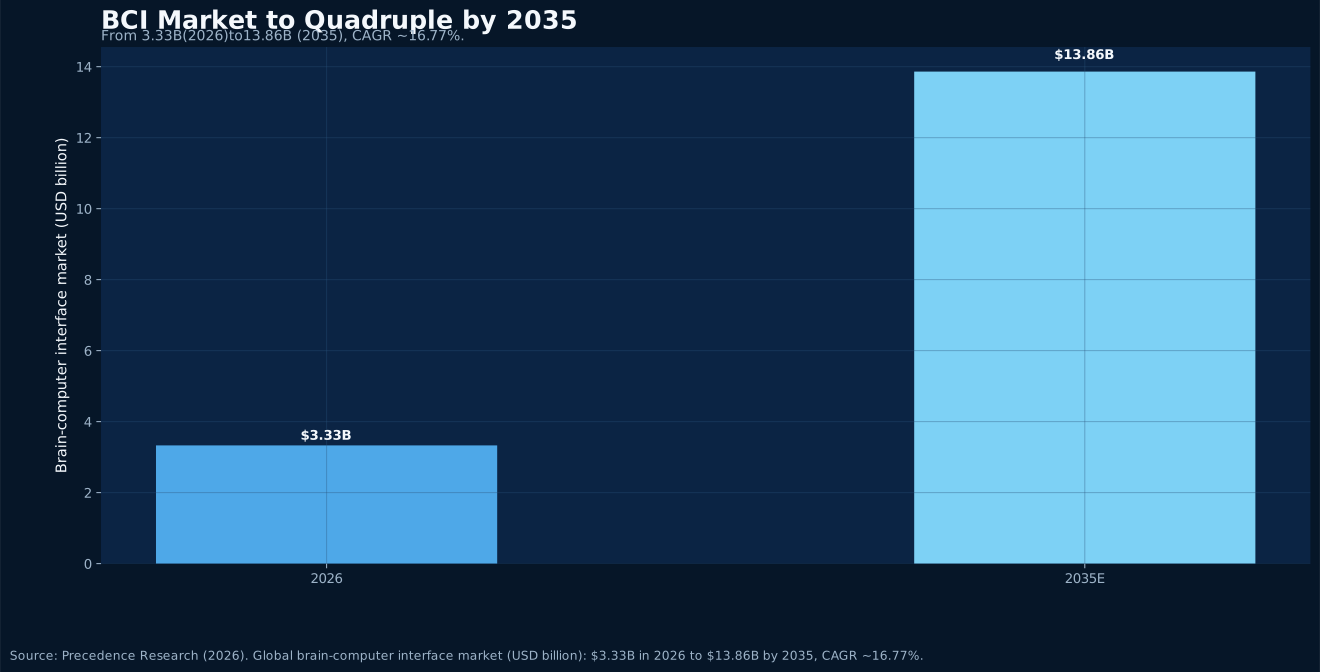
Brain-computer interfaces (BCI) are moving from the lab to the ward. Precedence Research estimates the global BCI market will grow from about $3.33B in 2026 to roughly $13.86B by 2035, a CAGR of about 16.77%. The pipeline matters more: since implanting its first participant, Noland Arbaugh, in January 2024, Neuralink has implanted 21 people across four nations and, in May 2026, launched UAE-PRIME in Abu Dhabi—its first clinical site outside North America. Non-invasive BCIs still hold ~61.7% market share, but the invasive route led by Neuralink is advancing fast. In 2026, BCI's core question has shifted from 'can we read brain signals' to 'can we help real patients at scale and repeatably.'
Read Article
Space Economy · 2026-07-13
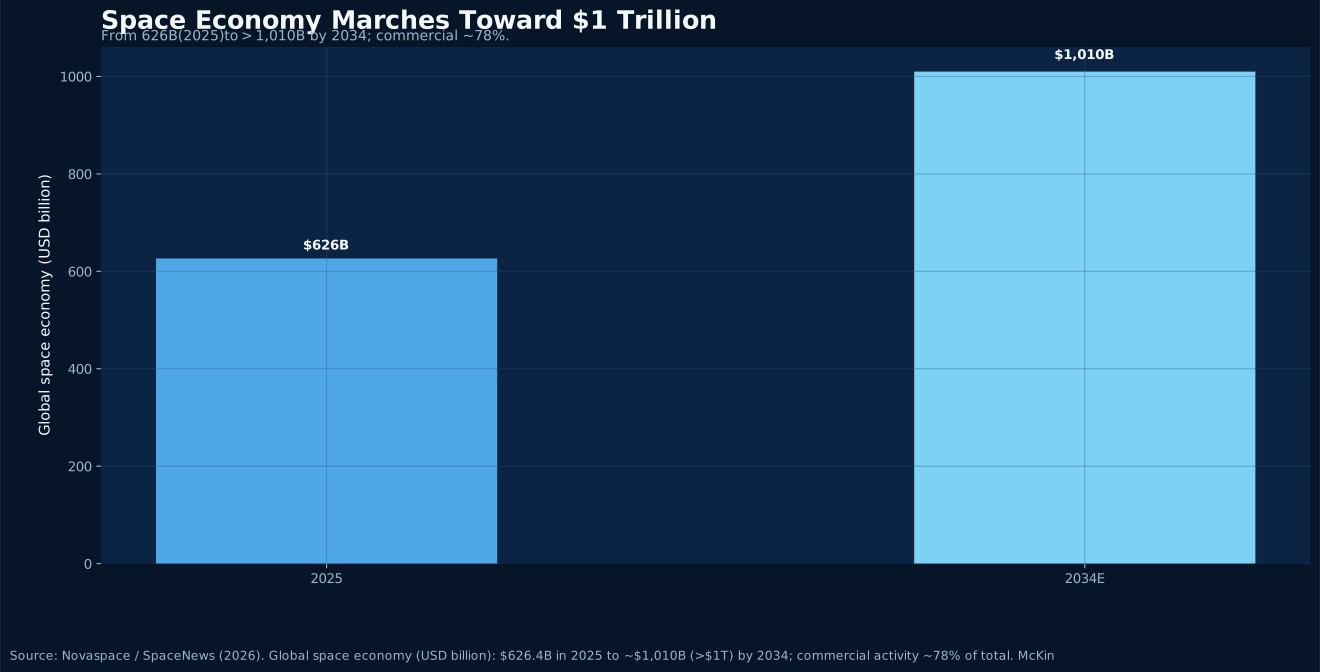
The space economy is crossing a historic threshold. Per Novaspace, the global space economy reached $626.4B in 2025 and is expected to top $1 trillion by 2034; commercial activity has risen to about 78% of the total, the main growth engine. The launch surge is just as striking: in 2025 global orbital launch attempts hit a record 324, more than double the pace of five years ago—of which SpaceX alone flew 165+ Falcon 9 missions, over 60% of global launches, reusing individual boosters 20+ times. Reusable rockets have pressed orbital cost to historic lows, turning 'access to space' from a state-only capability into a commercial service you can buy at scale. For satellite, comms, remote-sensing and cross-border logistics clients, space is shifting from a distant concept to usable infrastructure.
Read Article
Semiconductors · 2026-07-06
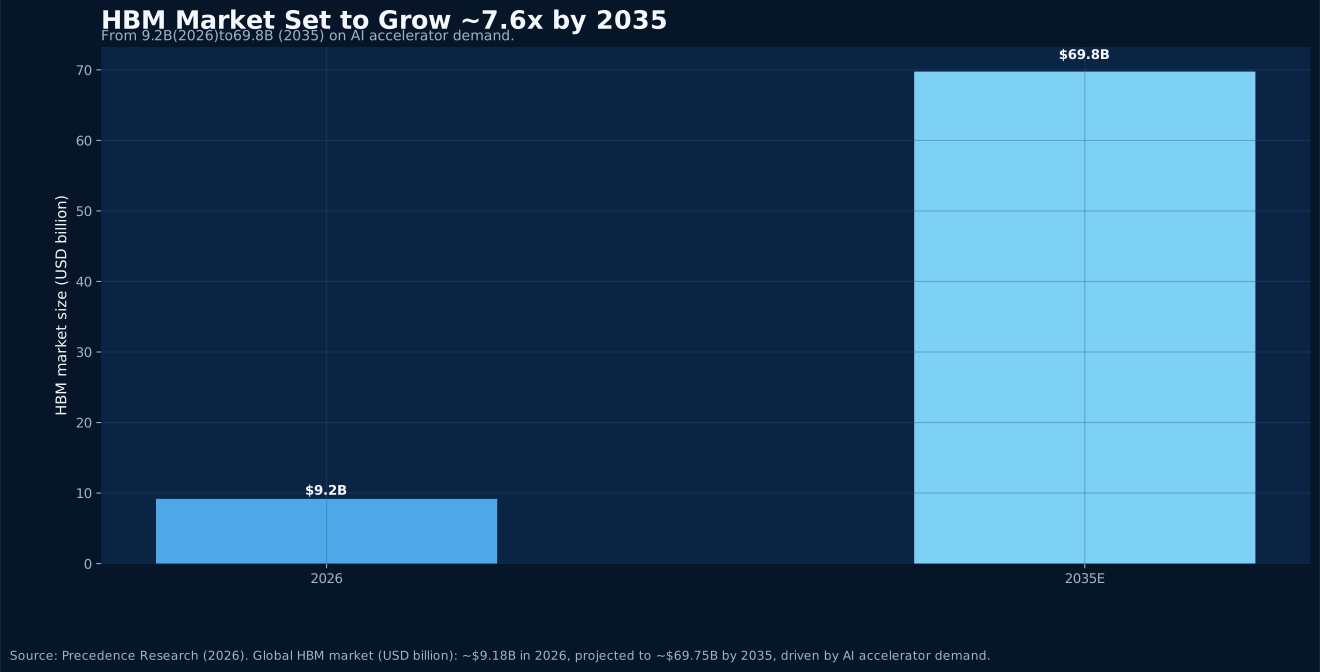
What powers the AI boom is not only GPUs but the high-bandwidth memory (HBM) sitting right next to the compute. As model training and inference scale exponentially, HBM has moved from a supporting role to the core bottleneck—and profit engine—of AI servers. Precedence Research expects the global HBM market to grow from about $9.18B in 2026 to roughly $69.75B by 2035. Supply is highly concentrated: SK Hynix leads with ~62% share, Micron has overtaken Samsung, and the 2026 battle has pivoted fully to sixth-generation HBM4. For MO-TEK's tech-supply-chain clients, reading this supercycle means an edge in sourcing and negotiating servers, storage and cooling.
Read Article
Energy Technology · 2026-07-06
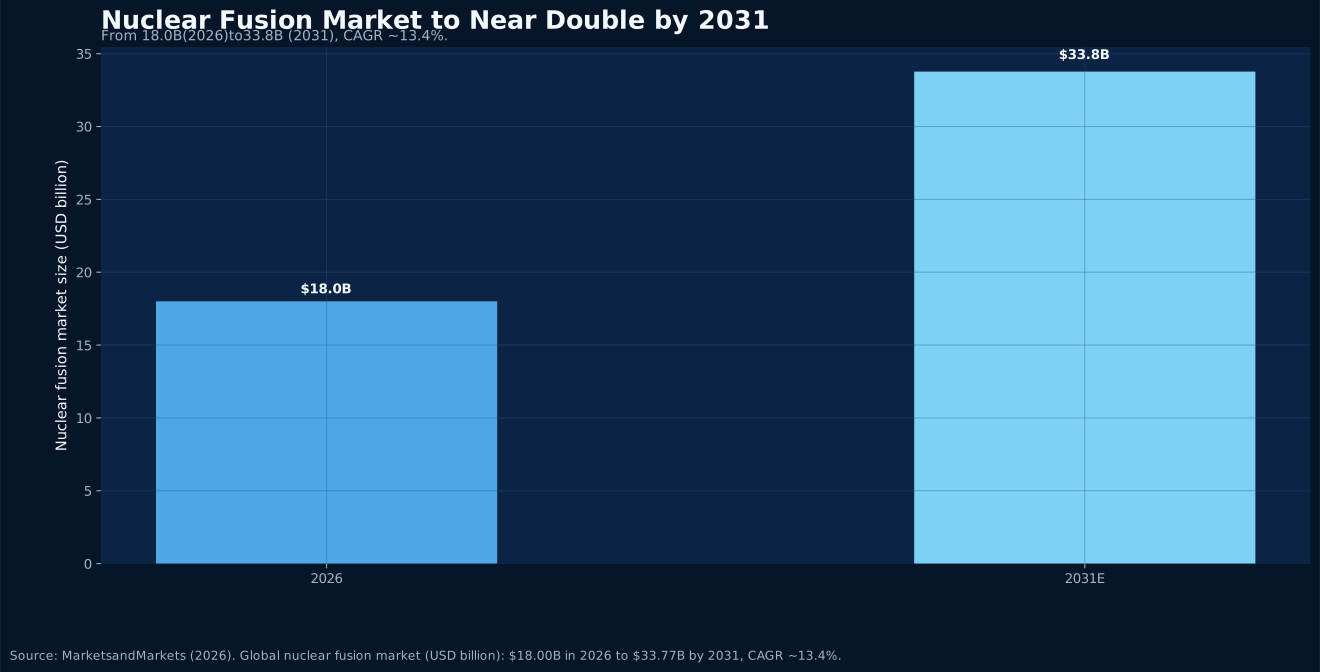
Long mocked as 'always thirty years away,' nuclear fusion is hitting a narrative turning point in 2026. AI data centers' hunger for clean, steady, load-adjacent power—stacked on steady engineering breakthroughs—pushes fusion from pure science toward the eve of commercialization. MarketsandMarkets expects the global fusion market to grow from about $18.0B in 2026 to roughly $33.77B by 2031. Capital is voting with its feet: Commonwealth Fusion Systems (CFS) closed a $3.85B round in May 2026, bringing cumulative funding to ~$6.85B and leading the private fusion pack. For energy and power-hungry industrial clients, fusion's commercialization pace is shifting from distant sci-fi to a variable worth building into long-term planning.
Read Article
Biotechnology · 2026-07-06
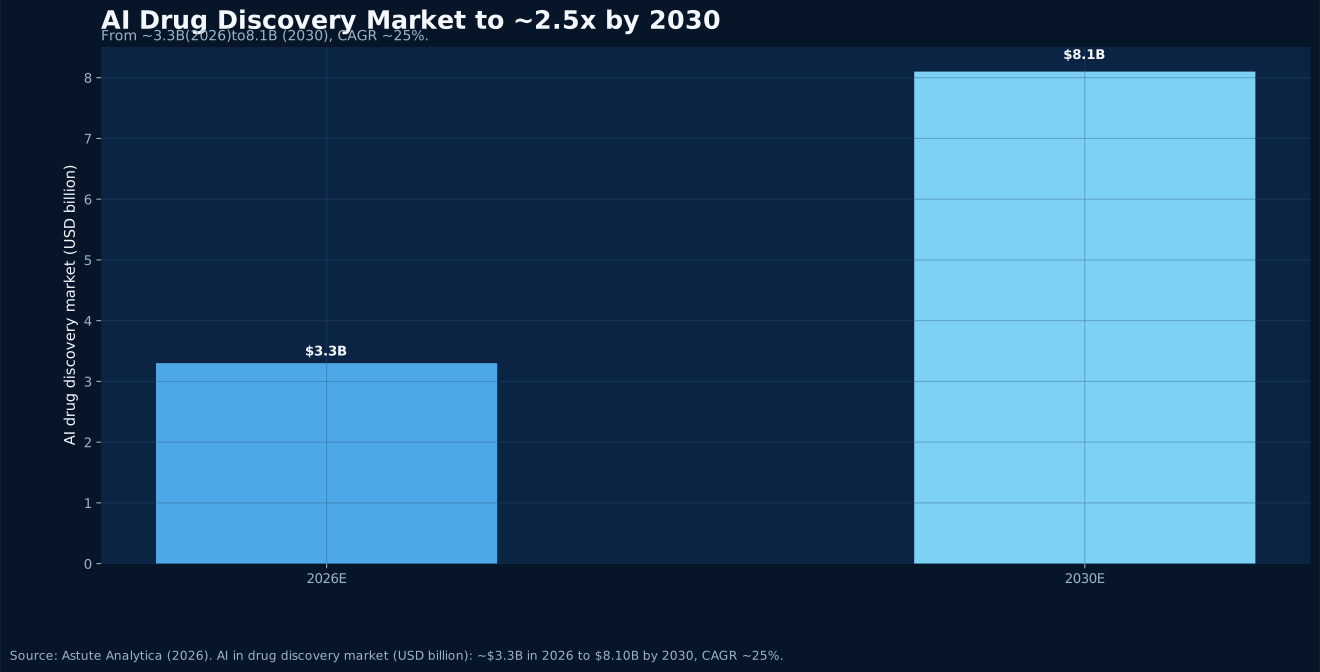
AI drug discovery is crossing from proving 'can it design a molecule' into testing 'can it actually work in the clinic.' Astute Analytica expects the global AI drug discovery market to grow from about $3.3B in 2026 to roughly $8.1B by 2030, a CAGR of about 25%. The pipeline matters more: 200+ AI-discovered drugs are now in clinical trials, ~175 AI-originated programs have entered human trials, and 15-20 are expected to reach pivotal Phase III in 2026. Yet as of mid-2026, no fully AI-designed drug has won FDA approval. For biopharma and cross-border health-industry clients, 2026 will be the watershed year that decides AI drug discovery's true worth.
Read Article
Autonomous Driving · 2026-06-29
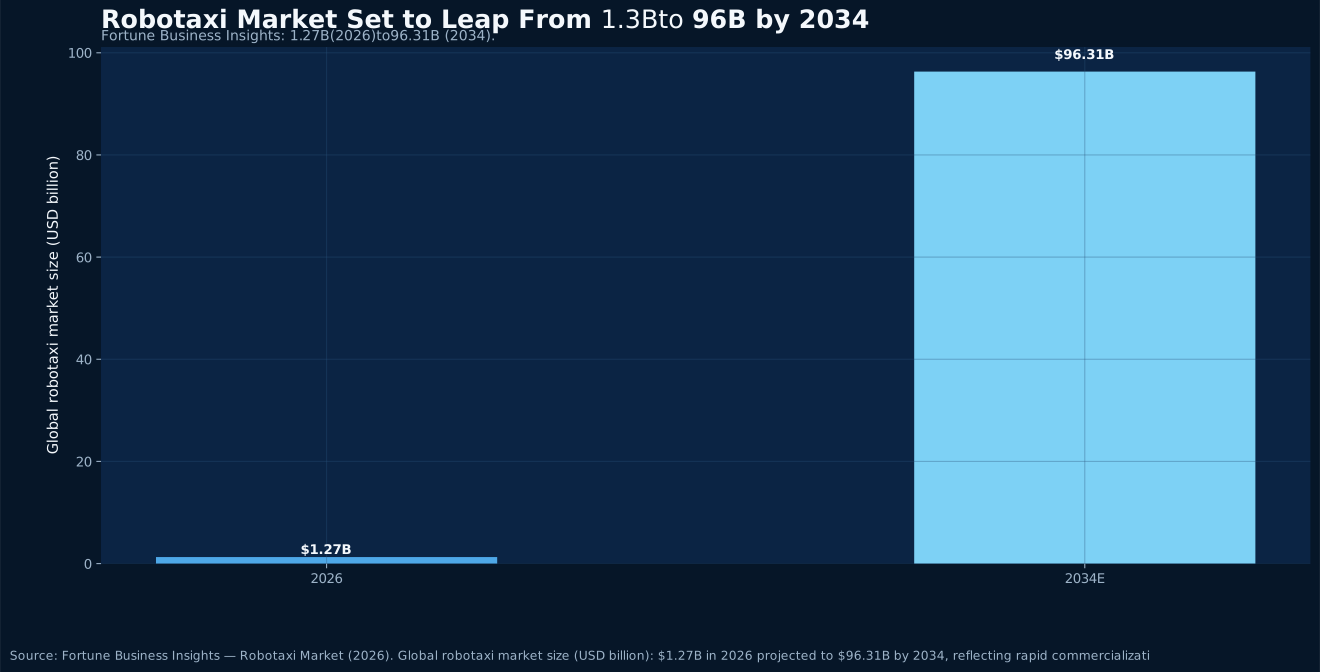
In 2026, robotaxis move decisively from pilots to scaled commercial service. Fortune Business Insights expects the global market to jump from about $1.27B in 2026 to roughly $96.31B by 2034. On fleets, Waymo leads with ~3,000 vehicles delivering ~500,000 paid rides per week; China is closing fast—Pony.ai has surpassed 1,700 vehicles and raised its year-end target to 3,500, while WeRide and Baidu Apollo Go run ~1,000 each and have reached fully driverless operations in the Middle East. Technology validation and commercial deployment now advance in parallel.
Read Article
Semiconductors · 2026-06-29
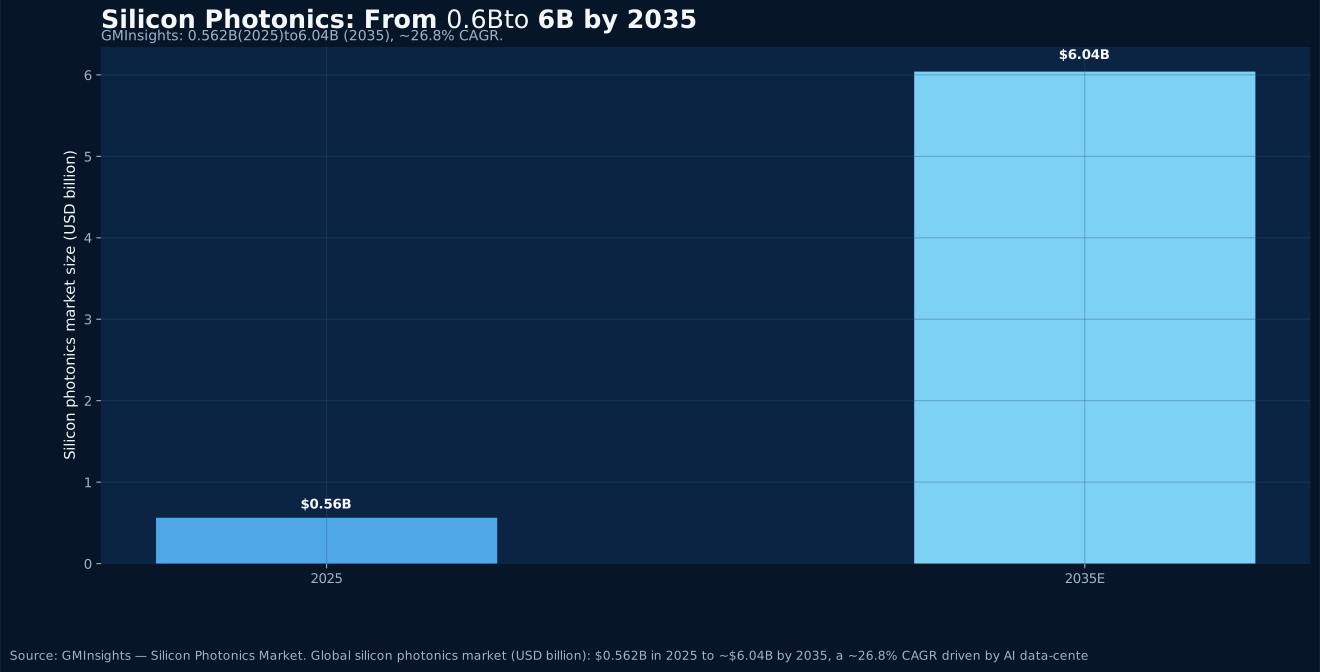
As AI clusters balloon, copper interconnects approach physical limits on bandwidth and power, making co-packaged optics (CPO) and silicon photonics the core of next-generation data-center interconnect. GMInsights expects the global silicon photonics market to grow from ~$0.562B in 2025 to ~$6.04B by 2035, a ~26.8% CAGR; IMARC sees CPO surging from ~$0.126B in 2025 to ~$3.84B by 2034, a ~44.9% CAGR. With NVIDIA and others pushing CPO into next-gen AI switches, optics-in, copper-out moves from trend to reality.
Read Article
Energy Technology · 2026-06-29
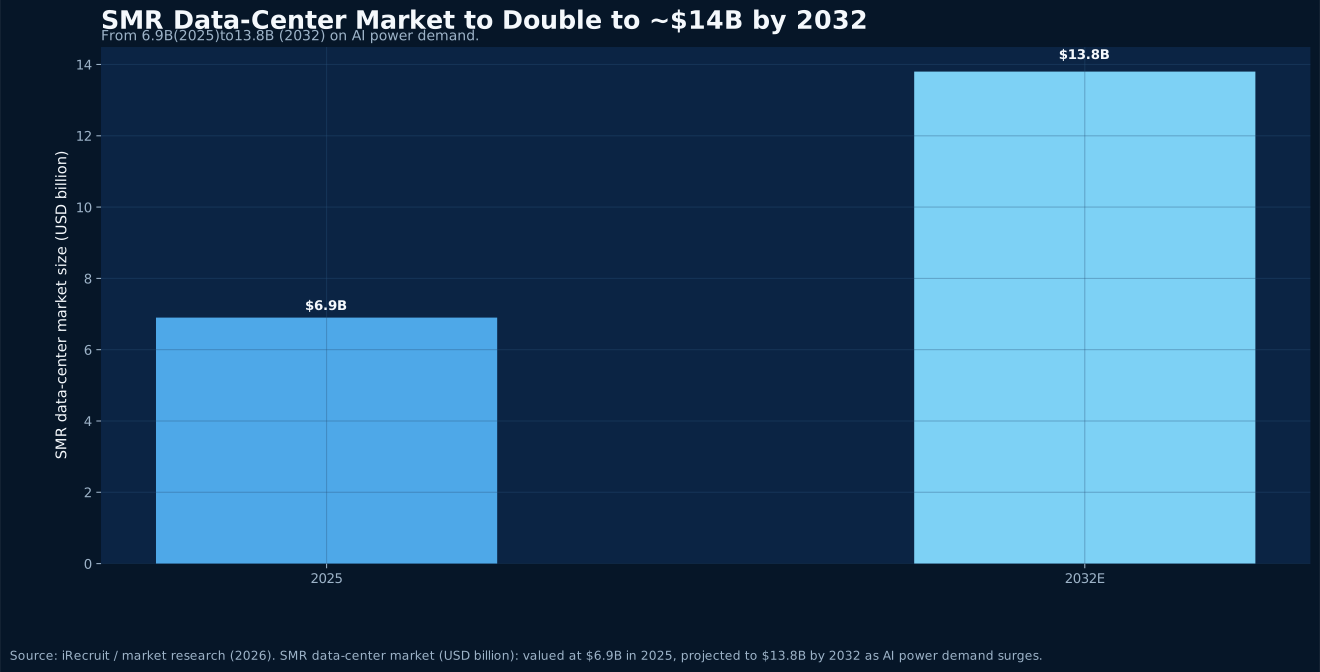
AI data centers' electricity demand is swelling at an unprecedented pace, pushing once-marginalized nuclear power back to center stage. Small modular reactors (SMRs)—with short build times, flexible siting and the ability to sit near loads—are an ideal power source in the eyes of tech giants. Research shows the SMR data-center market growing from about $6.9B in 2025 to roughly $13.8B by 2032. By mid-2026, the four largest U.S. tech firms had signed for over 9.8 GW of nuclear capacity, with Meta leading at up to ~6.6 GW. China's Linglong One is poised to become the world's first land-based commercial SMR.
Read Article
Battery Technology · 2026-06-22
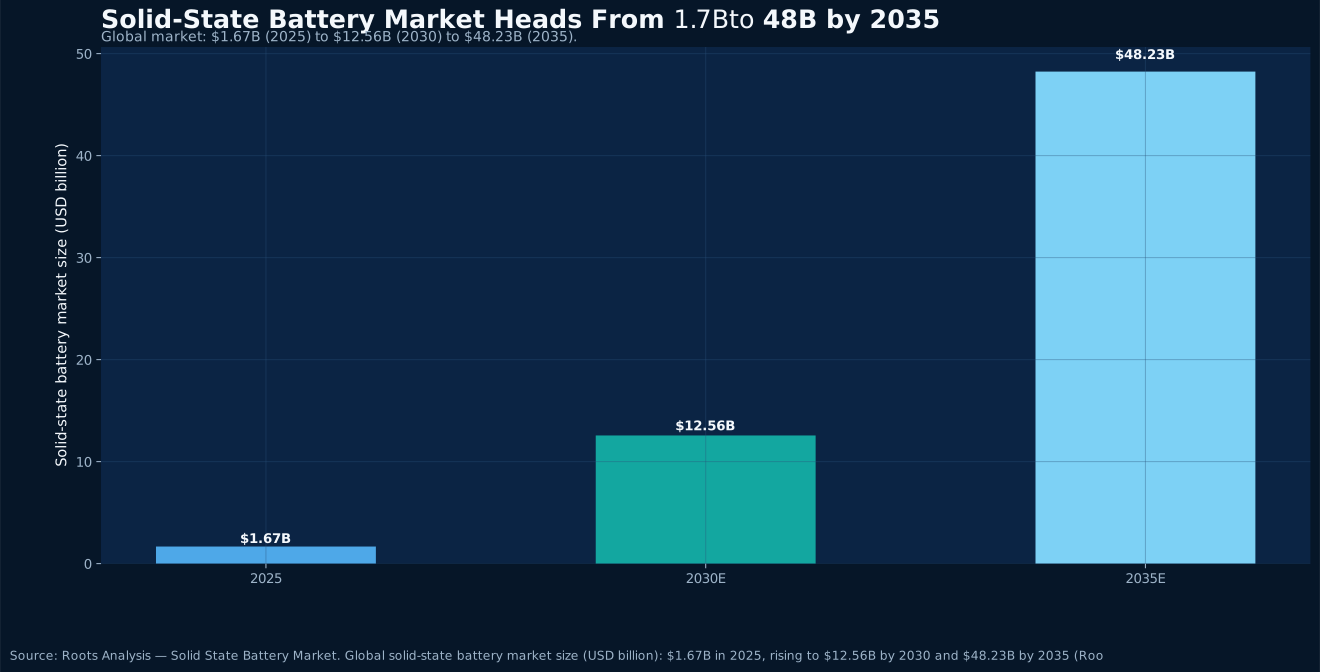
Solid-state batteries are moving from the lab to the eve of mass production. Roots Analysis projects the global market growing from ~$1.67B in 2025 to $12.56B by 2030 and $48.23B by 2035; while 2035 estimates range from $9B to $48B across firms, the direction is firmly upward. Mass-production timelines at Toyota, Samsung SDI, CATL and BYD are converging on 2027-2028, heralding a new battery era built on safety and energy density.
Read Article
Quantum Computing · 2026-06-22
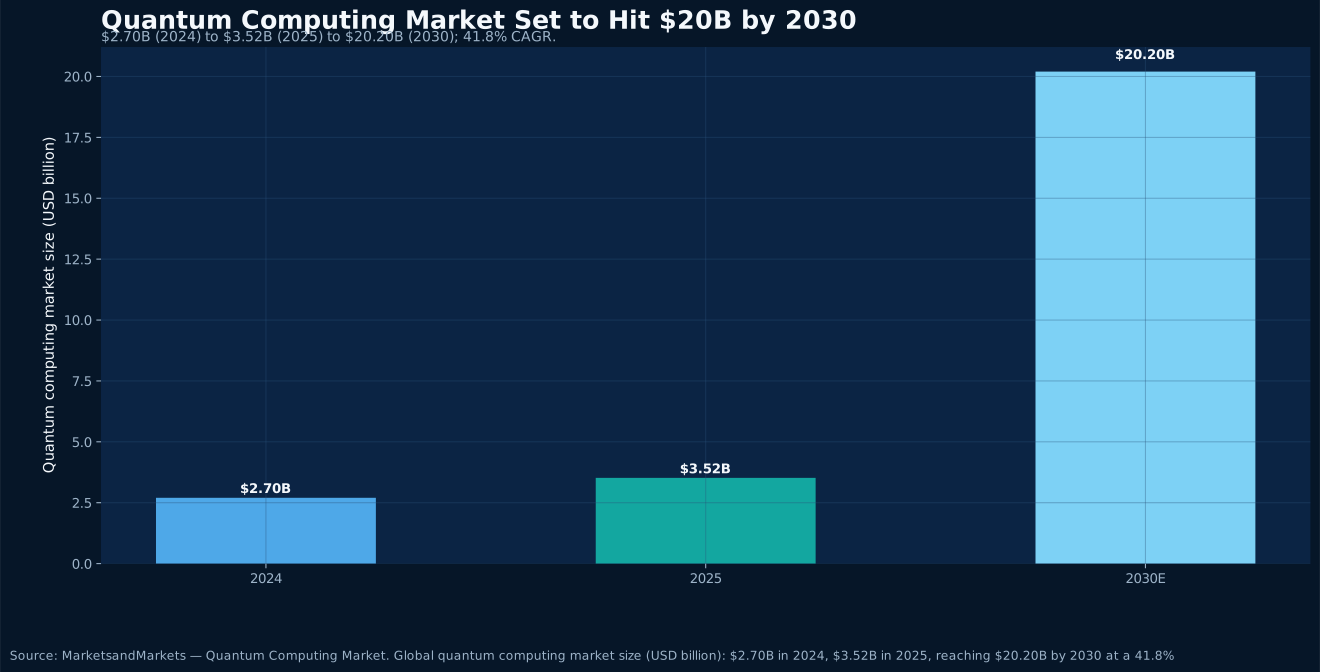
Quantum computing is moving from research to the commercial frontier. MarketsandMarkets expects the global market to grow from $2.70B in 2024 and $3.52B in 2025 to $20.20B by 2030, a 41.8% CAGR. On hardware, Google's Willow chip reached 105 qubits with an error-correction breakthrough, Fujitsu and RIKEN plan a 1,000-qubit machine in 2026, and IBM targets systems exceeding 4,000 qubits. With compute, error correction and cloud services advancing in parallel, the industrialization narrative is accelerating.
Read Article
Artificial Intelligence · 2026-06-22
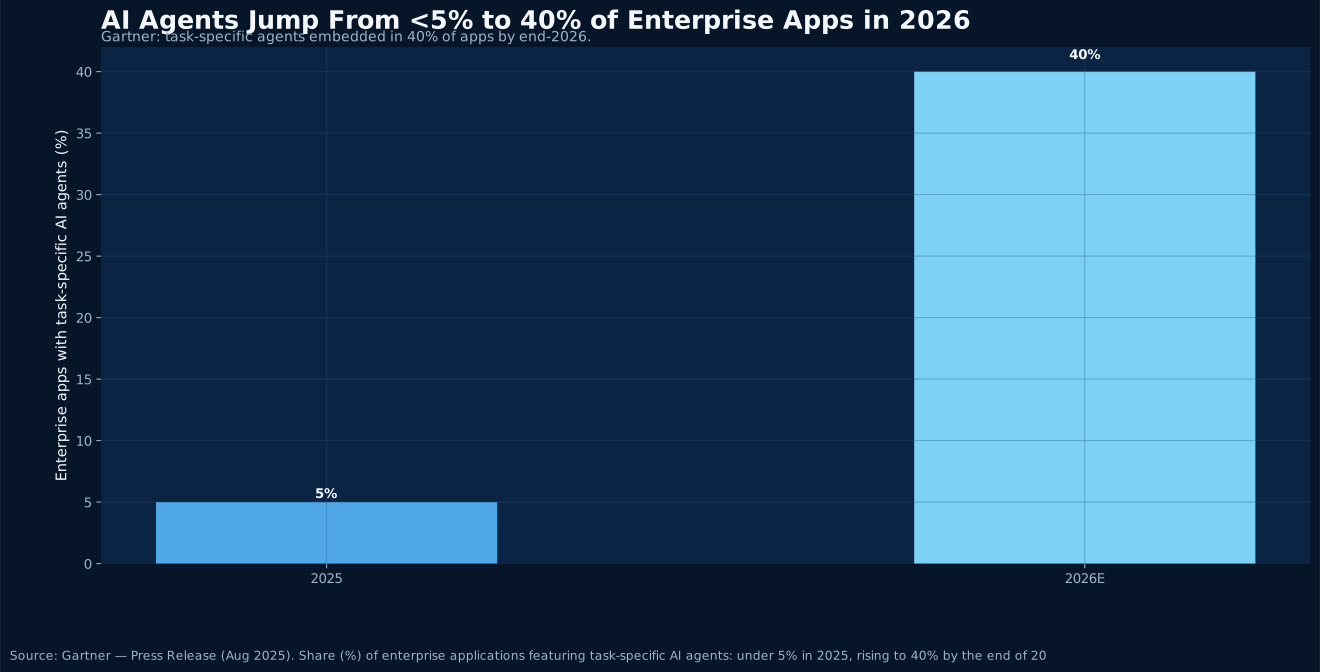
In 2026, agentic AI has become the central enterprise-deployment topic. Gartner expects 40% of enterprise applications to embed task-specific AI agents by the end of 2026, up from under 5% in 2025; the global AI-agents market is around $10.9-12.1B, growing at a 44-46% CAGR. Yet a clear gap remains: roughly 79% of enterprises have adopted agents to some degree, but only about 11% are in full production, and Gartner warns that over 40% of agentic projects may be canceled by end-2027. Opportunity and reality coexist.
Read Article
AI Infrastructure · 2026-06-19
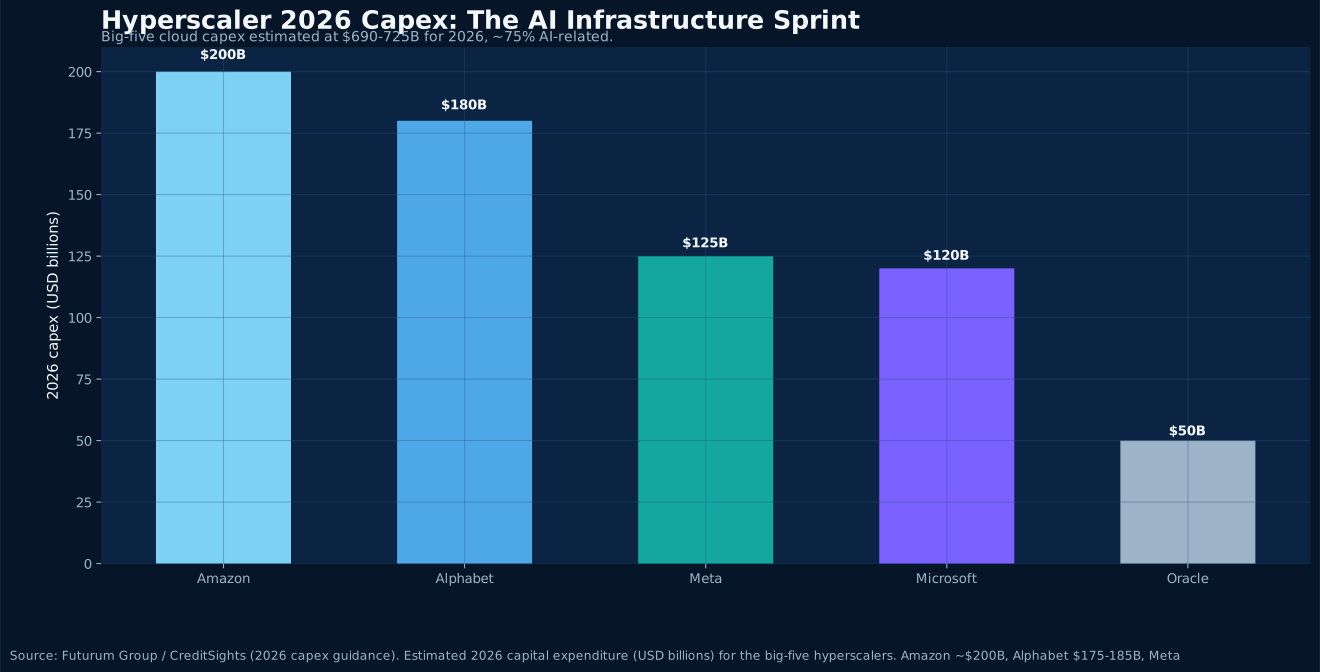
In 2026, hyperscaler AI-infrastructure investment is expanding at an unprecedented pace. Amazon, Google, Meta, Microsoft and Oracle together are expected to spend $690-725 billion in capex—up roughly 36-64% year over year, with about 75% going directly to AI. Meanwhile the IEA projects global data-center electricity use roughly doubling from ~485 TWh in 2025 to ~950 TWh by 2030. The combined pull on compute, power and components is reshaping global supply chains.
Read Article
Robotics · 2026-06-19
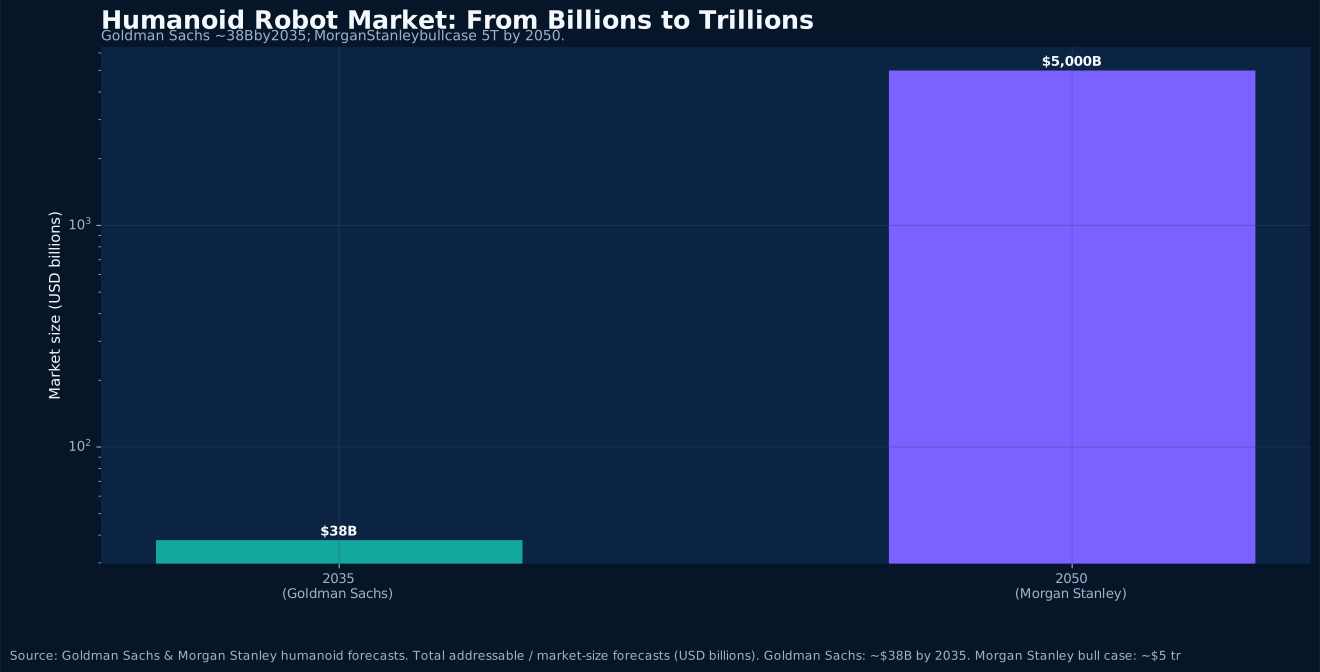
2026 is seen as the year humanoid robots commercialize. Goldman Sachs expects global shipments of 50,000-100,000 units this year, marking the shift from research and pilots to scaled production. Goldman sees the market reaching ~$38 billion by 2035 with annual shipments potentially topping one million units; Morgan Stanley is more bullish, projecting over one billion humanoids deployed globally by 2050 and a $5 trillion market in its bull case. Powered by actuators, reducers, sensors and AI 'brains,' a brand-new intelligent-hardware supply chain is taking shape.
Read Article
Electric Vehicles · 2026-06-19
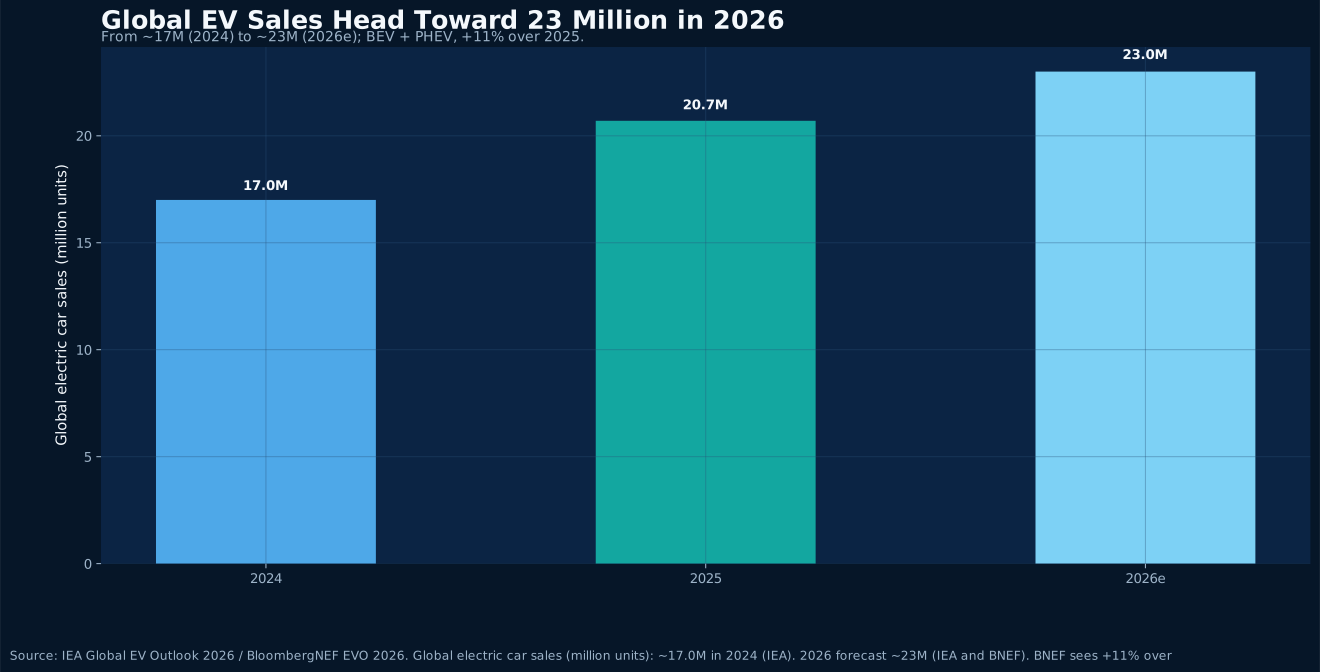
In 2026, the global EV market keeps setting records. The IEA expects full-year EV sales of ~23 million units, about 28% of global new-car sales; BloombergNEF lands close: ~23 million units, up ~11% year over year, with ~27% penetration. Behind the two houses' tightly aligned forecasts is a market crossing a tipping point—even as China and the US faced slower growth in Q1 2026, emerging markets and hybrids are taking over as the new engines of growth.
Read Article
Smart Hardware · 2026-06-07
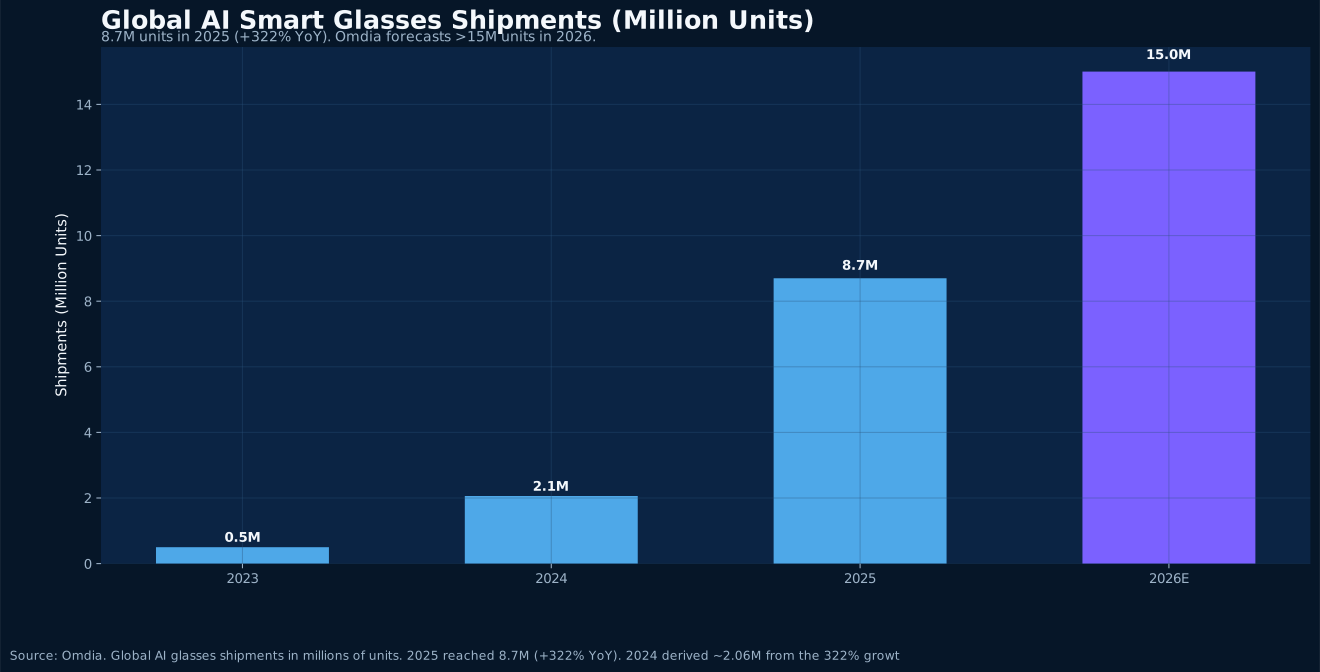
Per Omdia, global AI smart glasses shipments reached 8.7 million units in 2025, up 322% year-on-year, with 2026 forecast to exceed 15 million. Mainland China became the second-largest and fastest-growing market at ~10.9% share. China's supply-chain strength in display modules, acoustics and batteries is creating new OEM and sourcing opportunities for Korean and global brands.
Read Article
AI Infrastructure · 2026-06-07
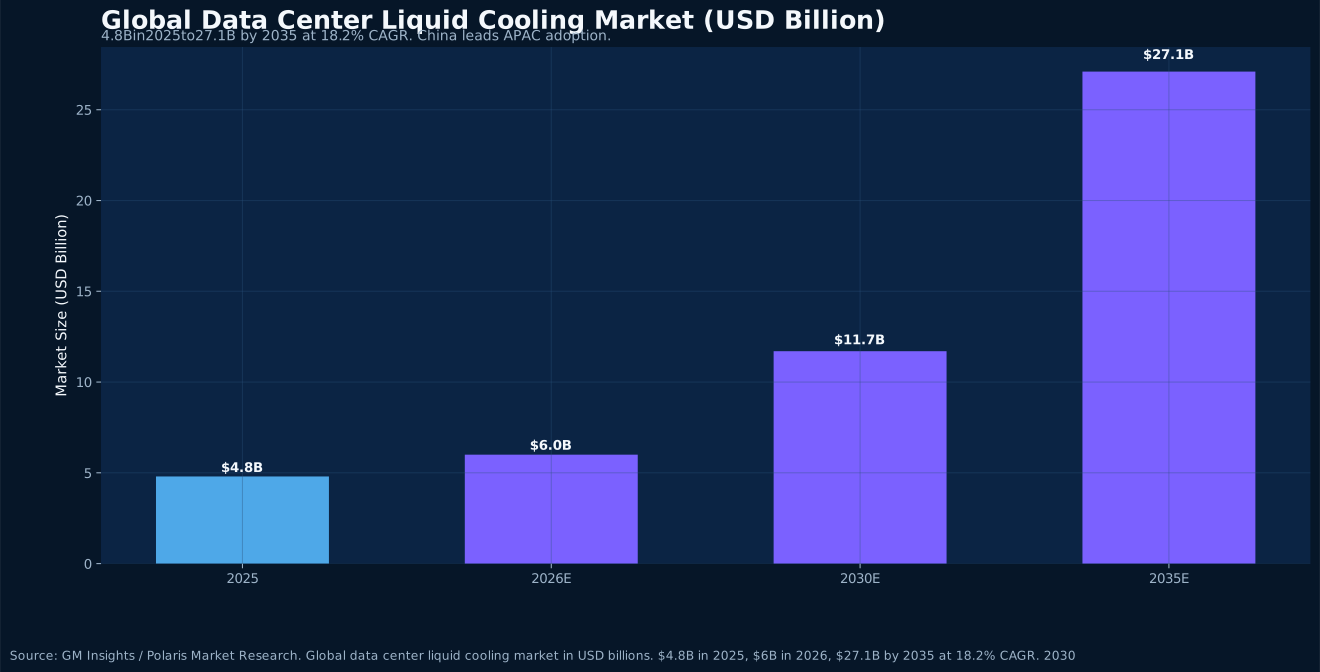
Surging AI-server power density is reshaping data-center cooling. The global data-center liquid-cooling market is forecast to grow from $4.8B in 2025 to $6B in 2026 and $27.1B by 2035, an 18.2% CAGR. With a strict PUE ≤1.3 policy and large-scale deployments by Alibaba, Tencent, ByteDance and Huawei, China leads APAC liquid-cooling adoption, opening growth space for related equipment and materials trade.
Read Article
Satellite Internet · 2026-06-07
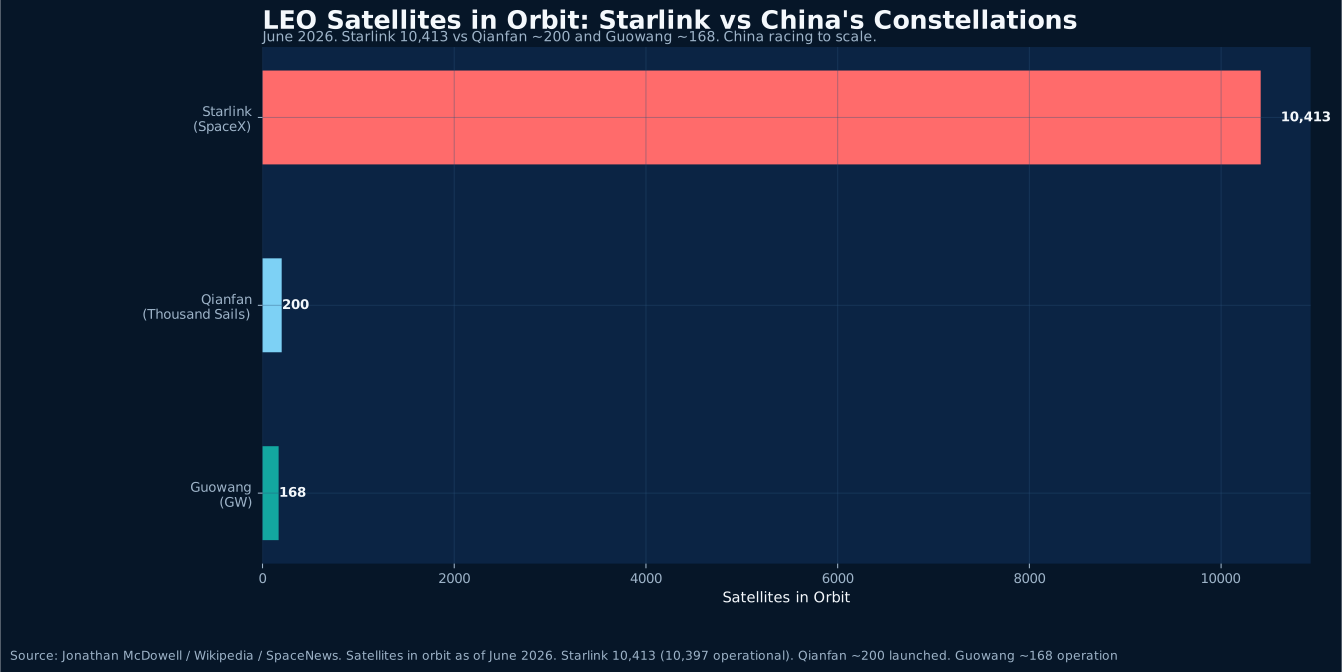
As of June 2026, SpaceX's Starlink has deployed over 10,400 satellites, while China's Qianfan (~200) and Guowang (~168) remain at an early stage. Yet the two constellations together plan over 28,000 satellites, with Qianfan targeting 5,000 launches in a single year by 2030. Across LEO satellite manufacturing, launch capacity and terminal equipment, China is mounting a mega-constellation race over digital-infrastructure sovereignty, driving global sourcing demand across the value chain.
Read Article
Semiconductors & AI · 2026-05-25
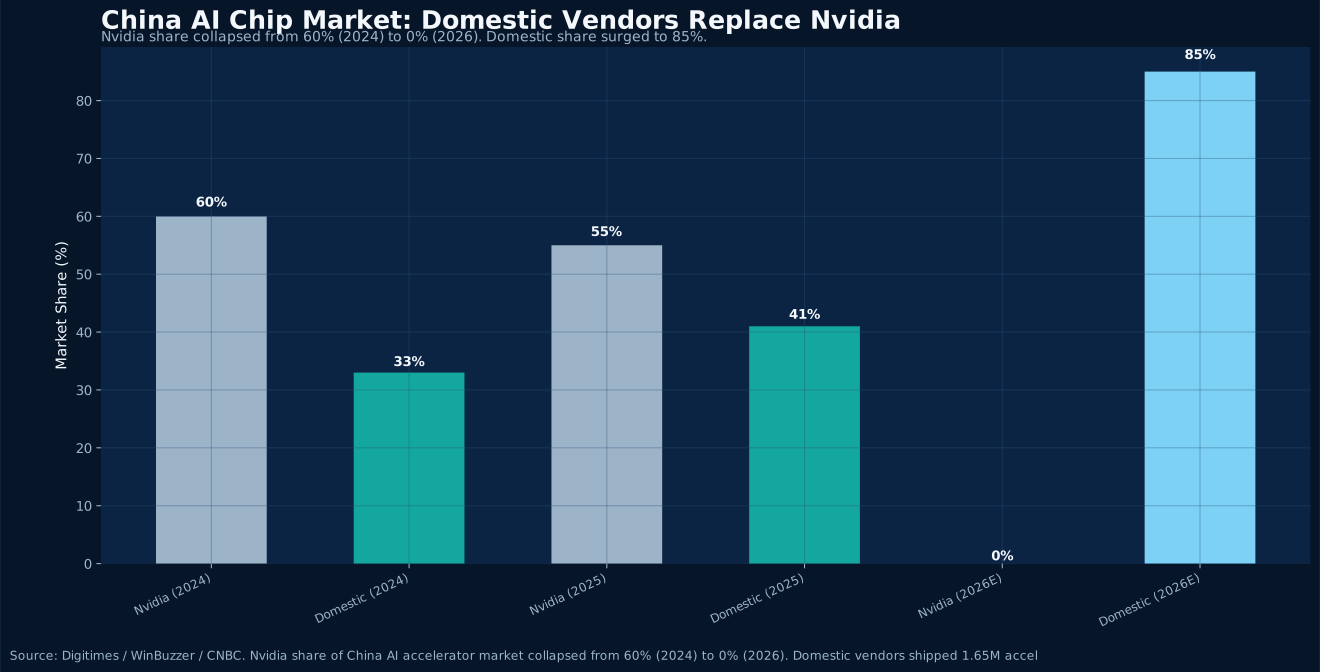
NVIDIA CEO Jensen Huang admits ‘largely conceding’ China’s AI chip market. Huawei targets $12B AI chip revenue in 2026 (+60% YoY). Domestic market share surged from 33% in 2024 to 85% in 2026, with Morgan Stanley projecting a $67B market by 2030.
Read Article
Robotics & Automation · 2026-05-25
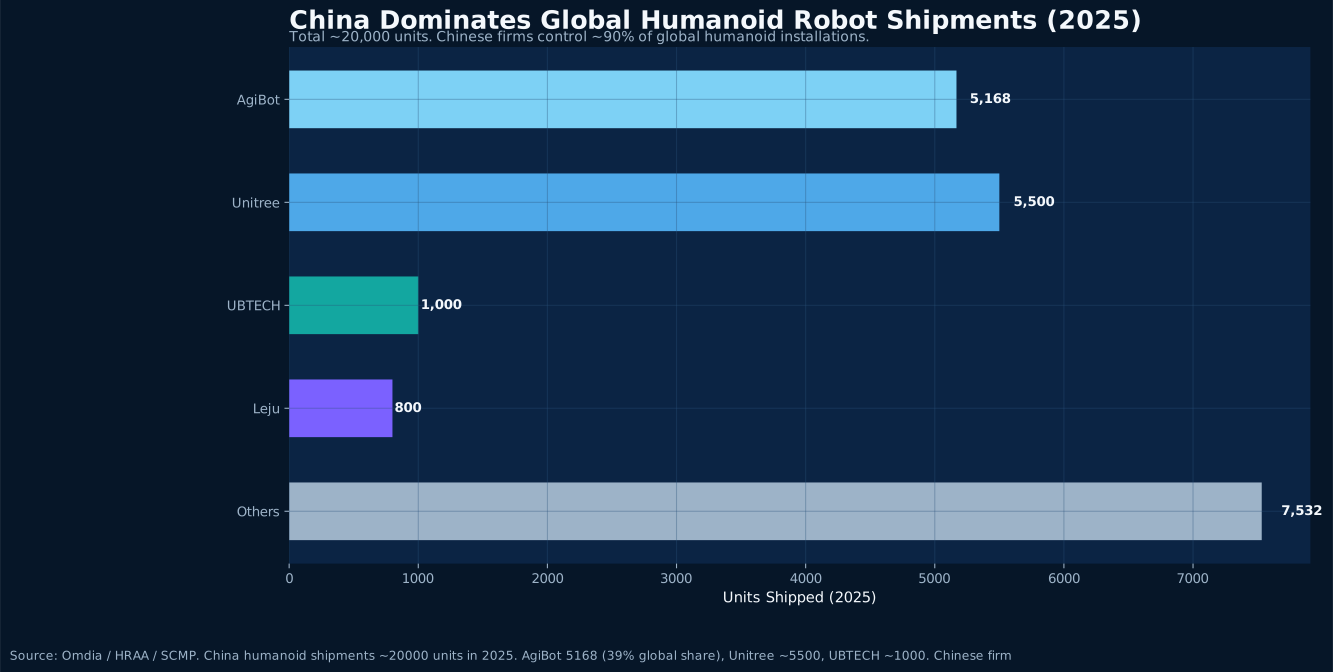
Chinese humanoid robot firms shipped ~20,000 units in 2025, with AgiBot and Unitree each exceeding 5,000 units, capturing ~90% of global installations. TrendForce projects 94% production growth in 2026, and Morgan Stanley doubled its delivery forecast to 28,000 units. Korea’s Smart Factory expo hosted five Chinese humanoid firms for the first time.
Read Article
Smart Manufacturing · 2026-05-25
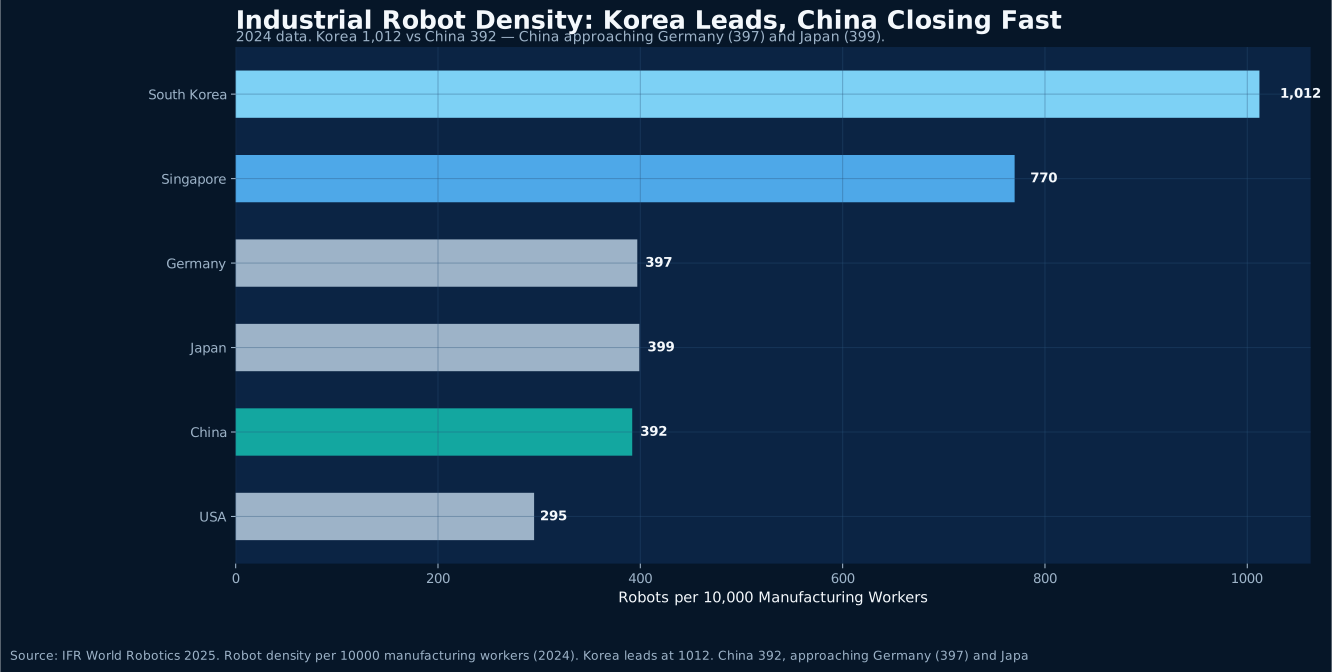
Korea leads globally with 1,012 robots per 10,000 manufacturing workers. China installed 295,000 units in 2024 (54% global share). Korea’s 2026 smart factory budget rose 70% to KRW 402B, while China’s MIIT blueprint pushes large AI models into manufacturing. Their automation complementarity is creating new trade opportunities.
Read Article
Semiconductors & AI Chips · 2026-05-18
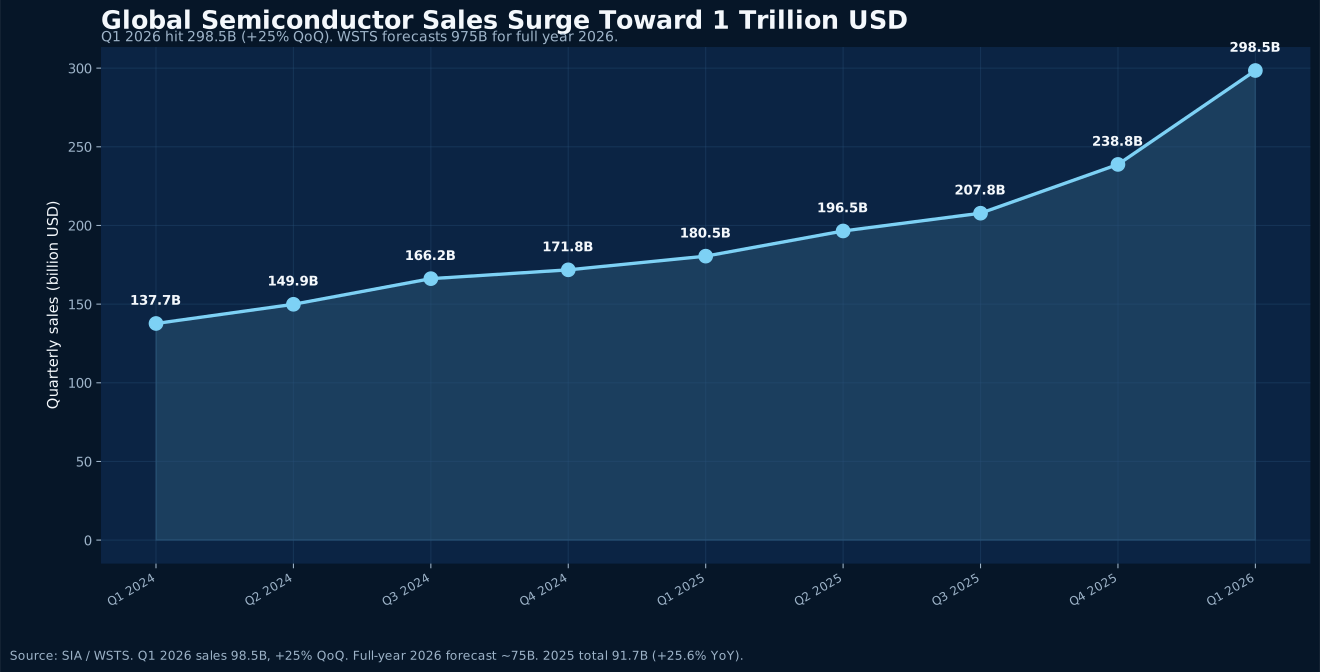
Global semiconductor sales hit $298.5B in Q1 2026, up 25% QoQ. Korea’s April chip exports surged to $31.9B driven by HBM and AI server demand, while China accelerates wafer self-sufficiency targets.
Read Article
EV & Battery · 2026-05-18
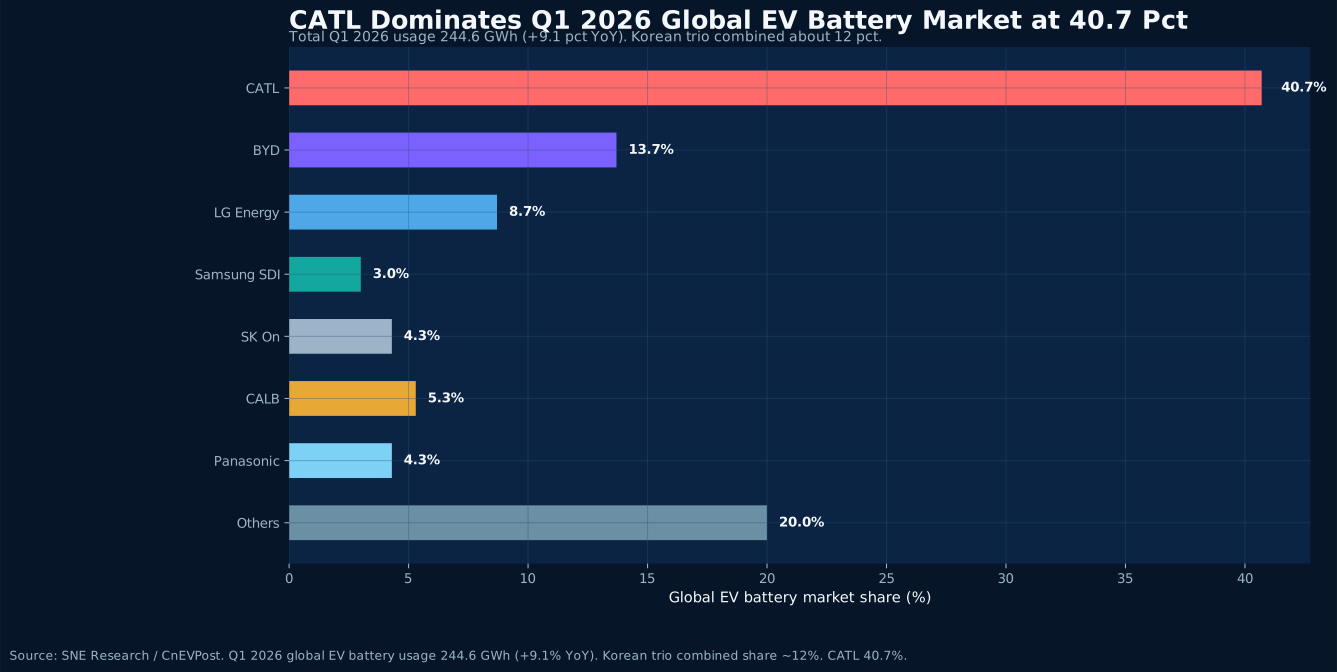
Global EV battery installations reached 244.6 GWh in Q1 2026, with CATL leading at 40.7%. The Korean trio’s combined share fell to 12% as the LFP route’s rise redefines the China-Korea battery supply chain landscape.
Read Article
Beauty & Cosmetics · 2026-05-18
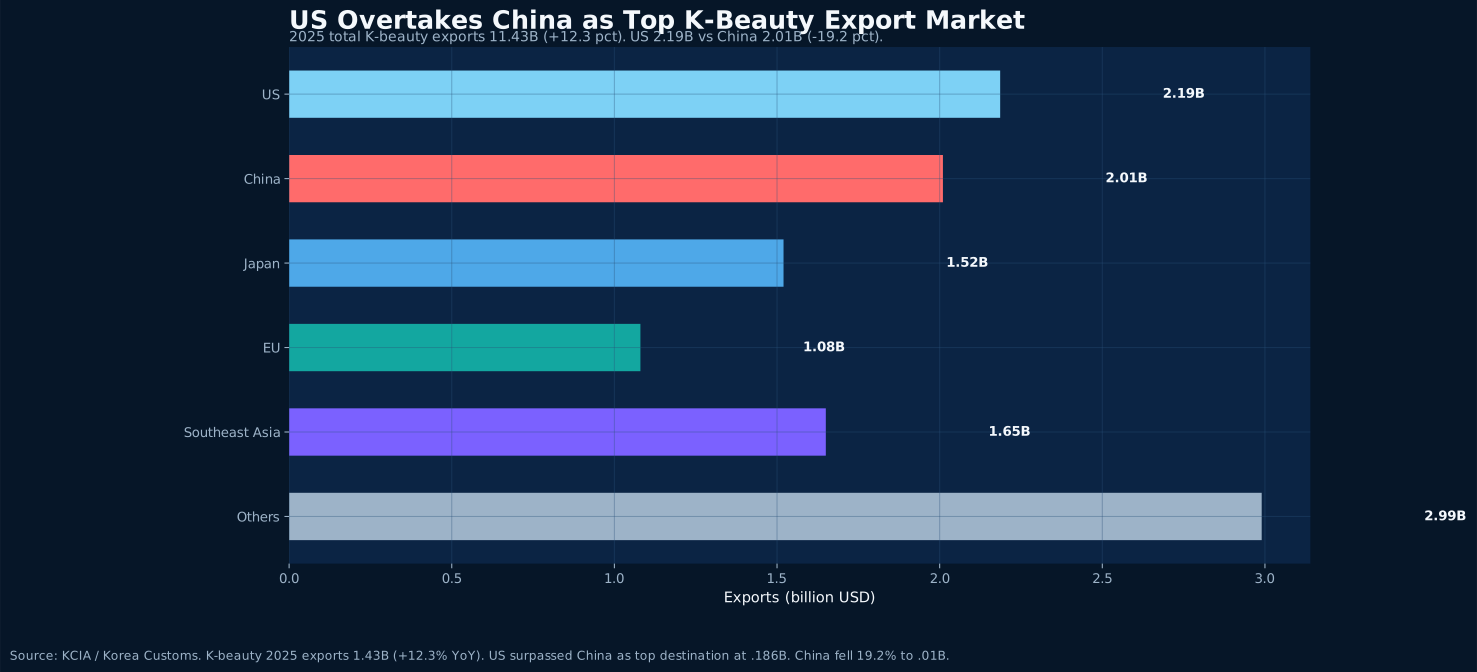
China’s NMPA launches a three-year e-label pilot across seven regions while Korea’s MFDS advances mandatory safety assessments by 2031. K-beauty exports hit $11.43B but China fell 19.2%, as bilateral regulatory convergence creates new compliant trade windows.
Read Article
International Trade Insight · 2026-05-11
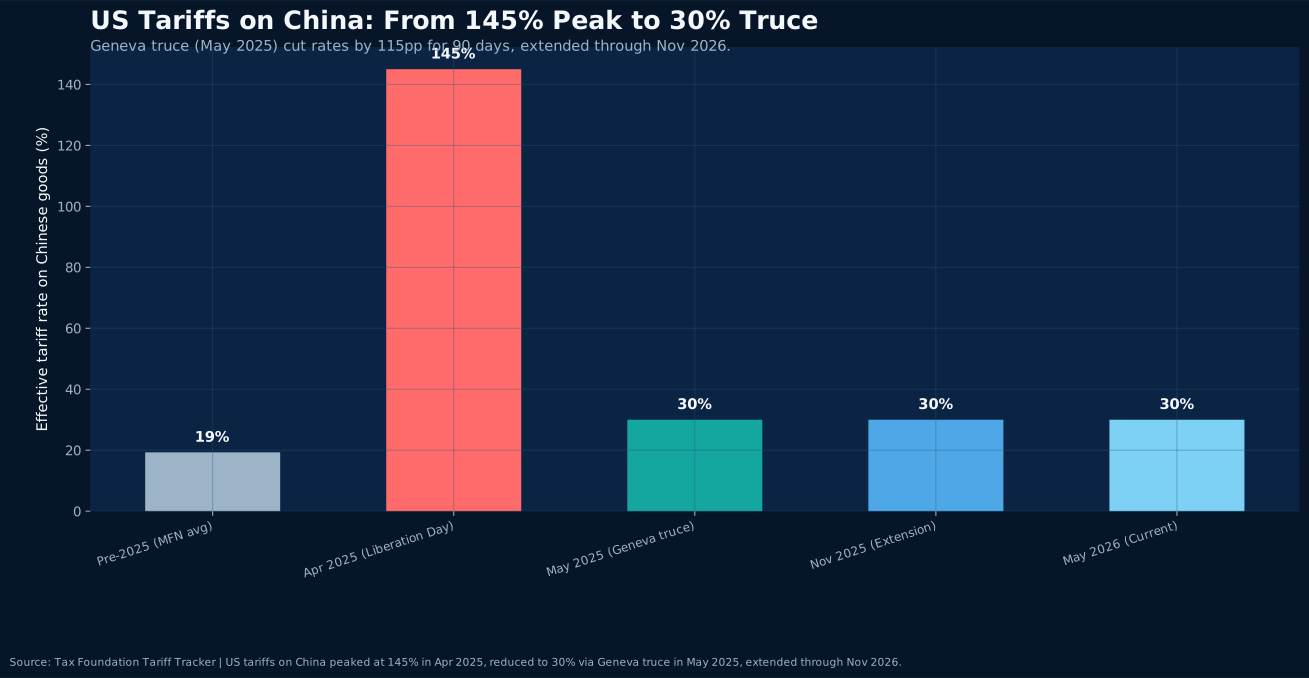
The US-China Geneva tariff truce cut duties from 145% to 30% and extended through November 2026. Korea, as China’s top semiconductor supplier and a US trade surplus partner, faces both transshipment scrutiny and strategic supply chain restructuring opportunities.
Read Article
Cross-Border E-Commerce Insight · 2026-05-11
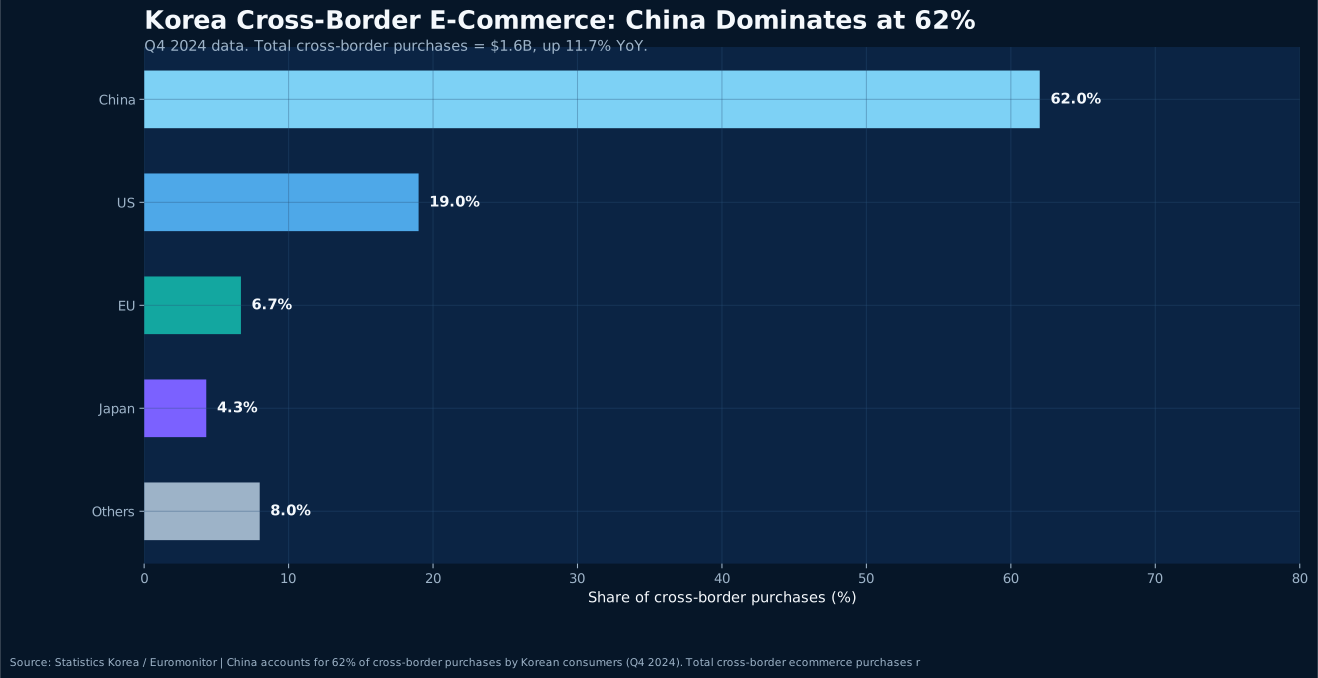
Chinese cross-border platforms command 62% of Korea's overseas direct purchase market, but Seoul inspections found 144 products with toxic substances exceeding safe limits. KFTC launched data compliance investigations. 2026 is the industry's 'Year of Compliance' as product safety, data protection, and consumer rights regulations escalate simultaneously.
Read Article
Food Trade Insight · 2026-05-11
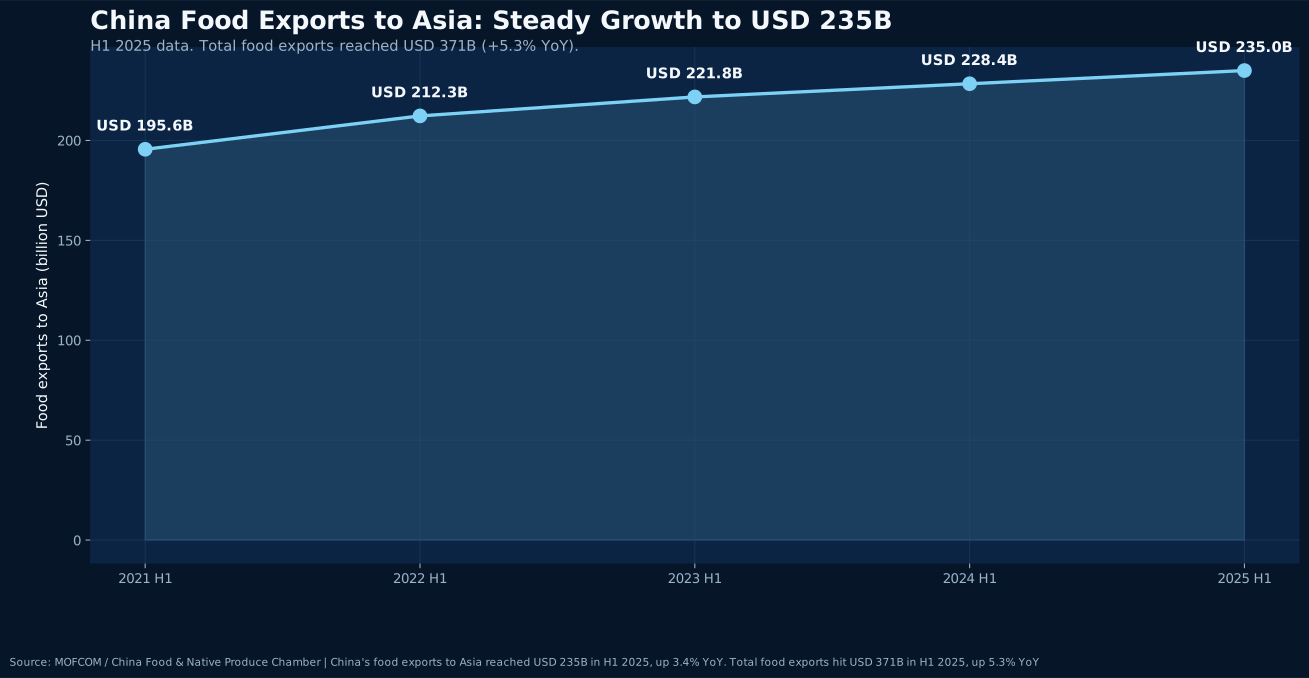
China's food exports to Asia reached $235B in H1 2025, but MFDS violations on Chinese food imports persist. Korea revised its Special Act on Imported Food Safety—simplifying poultry feed imports while tightening processed food scrutiny. China-Korea food trade firms must balance compliance investment with market opportunity.
Read Article
Supply Chain Insight · 2026-05-06
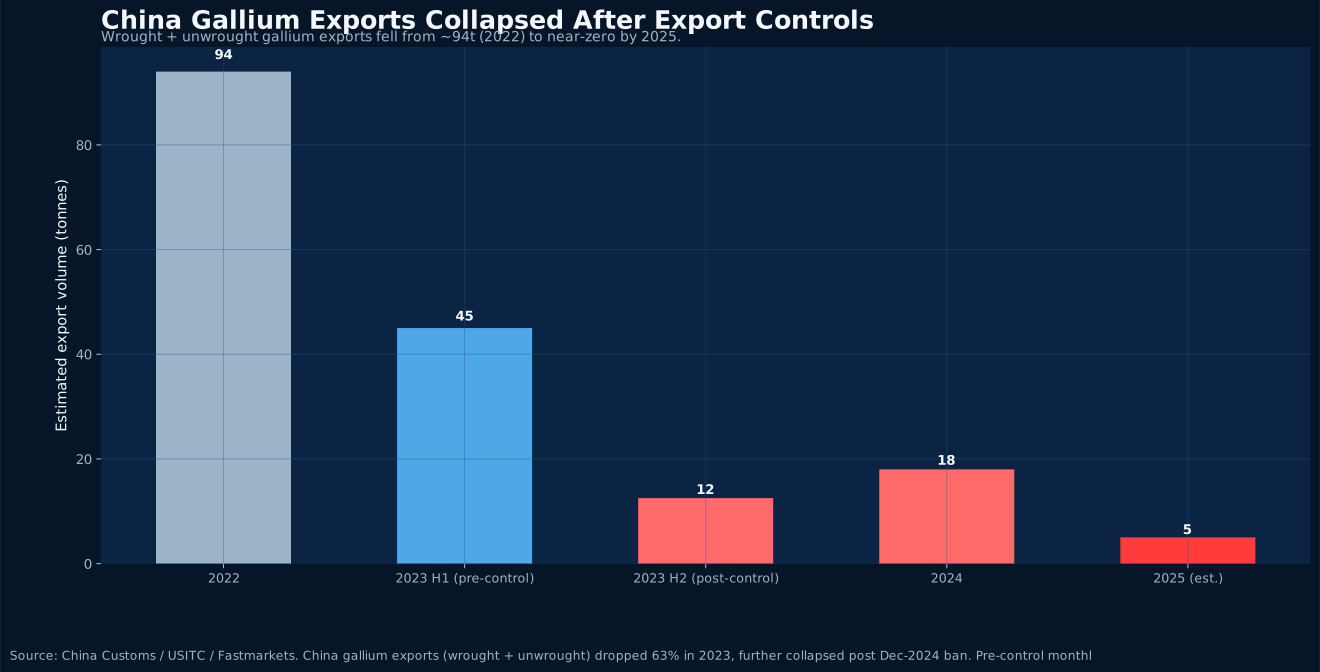
China’s escalating export controls on gallium, germanium, and antimony have reshaped global supply. Korea, a semiconductor and battery powerhouse, is responding through reserve expansion, dedicated funding, and international partnerships.
Read Article
Policy Insight · 2026-05-06
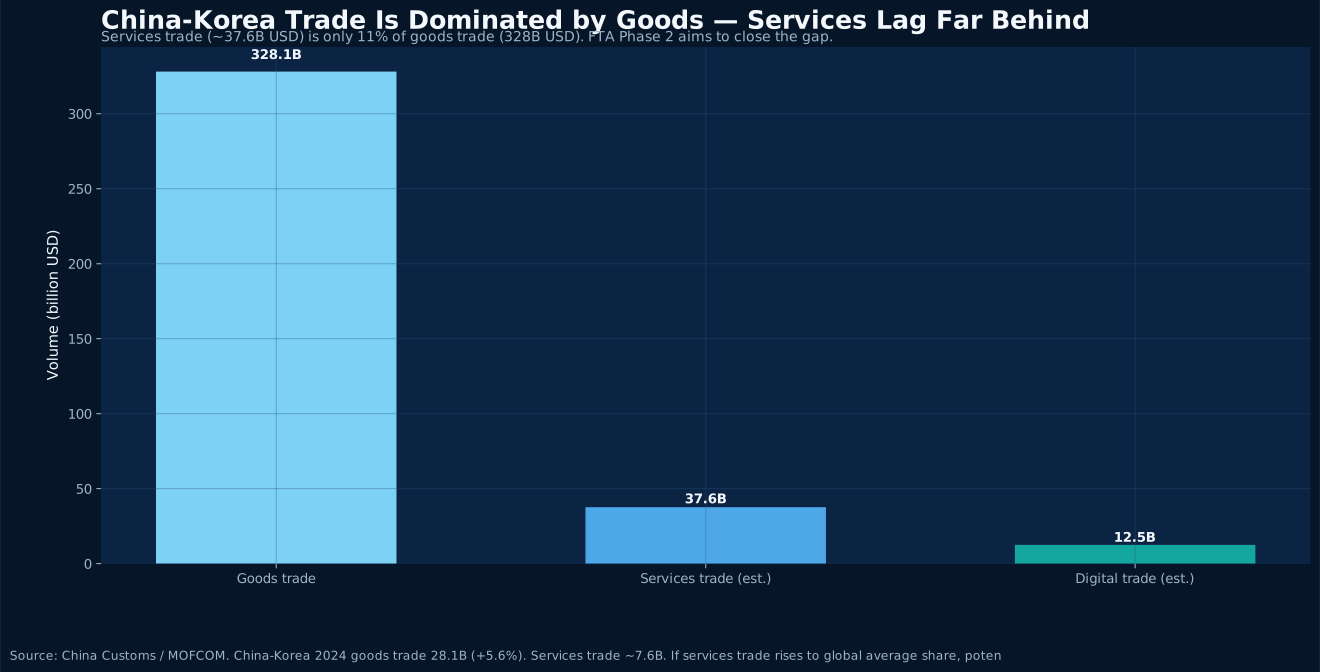
The 13th round of China-Korea FTA Phase 2 negotiations has been completed, with services trade, investment rules, and negative lists at the center. A 2026 breakthrough could shift bilateral economic relations from goods-dominated to services-plus-investment dual-driven.
Read Article
International Trade Insight · 2026-05-06
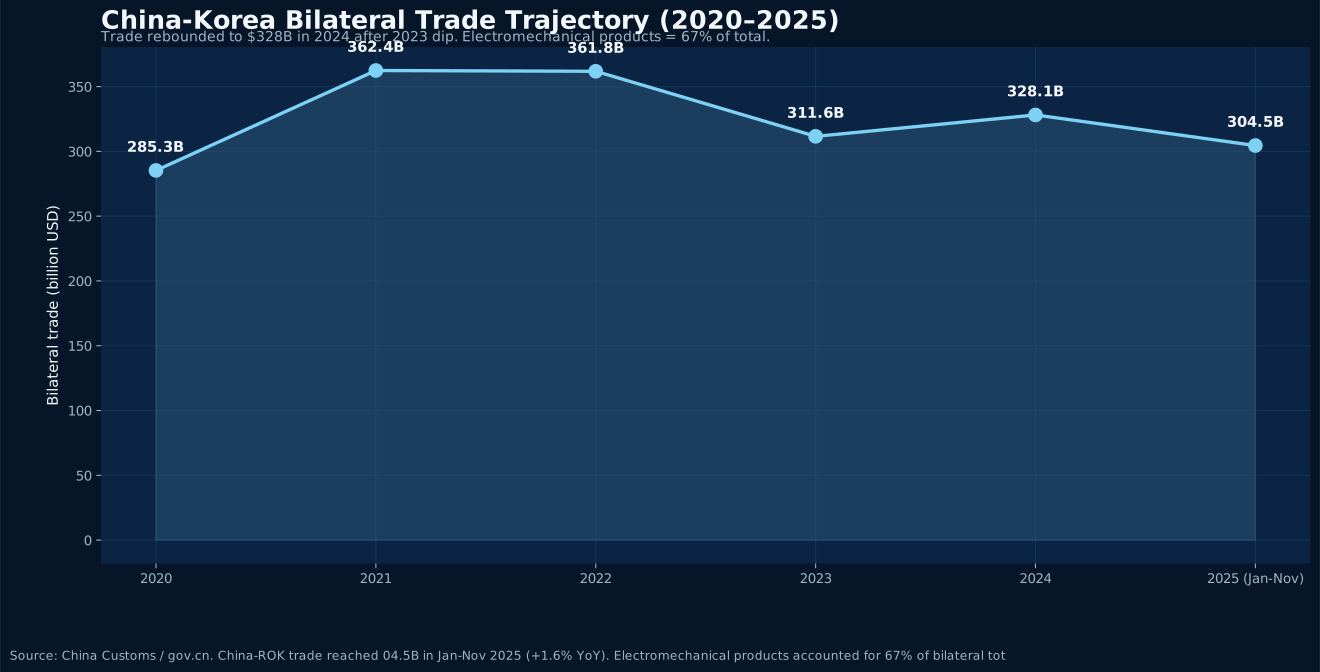
China hosts APEC 2026 with supply chain resilience, digital economy, and sustainable trade as core themes. China-Korea trade faces both regulatory adjustment pressure and strategic opportunities for industrial upgrading and market access under this multilateral framework.
Read Article
Automotive & New Energy · 2026-04-25
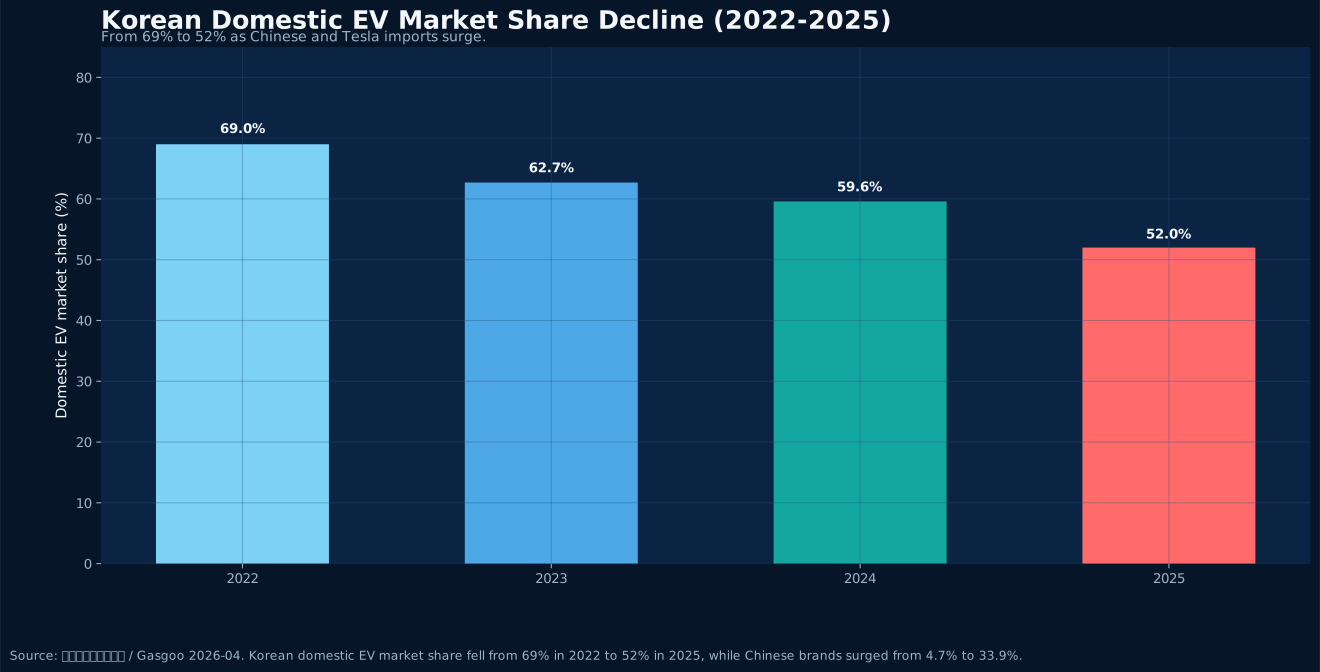
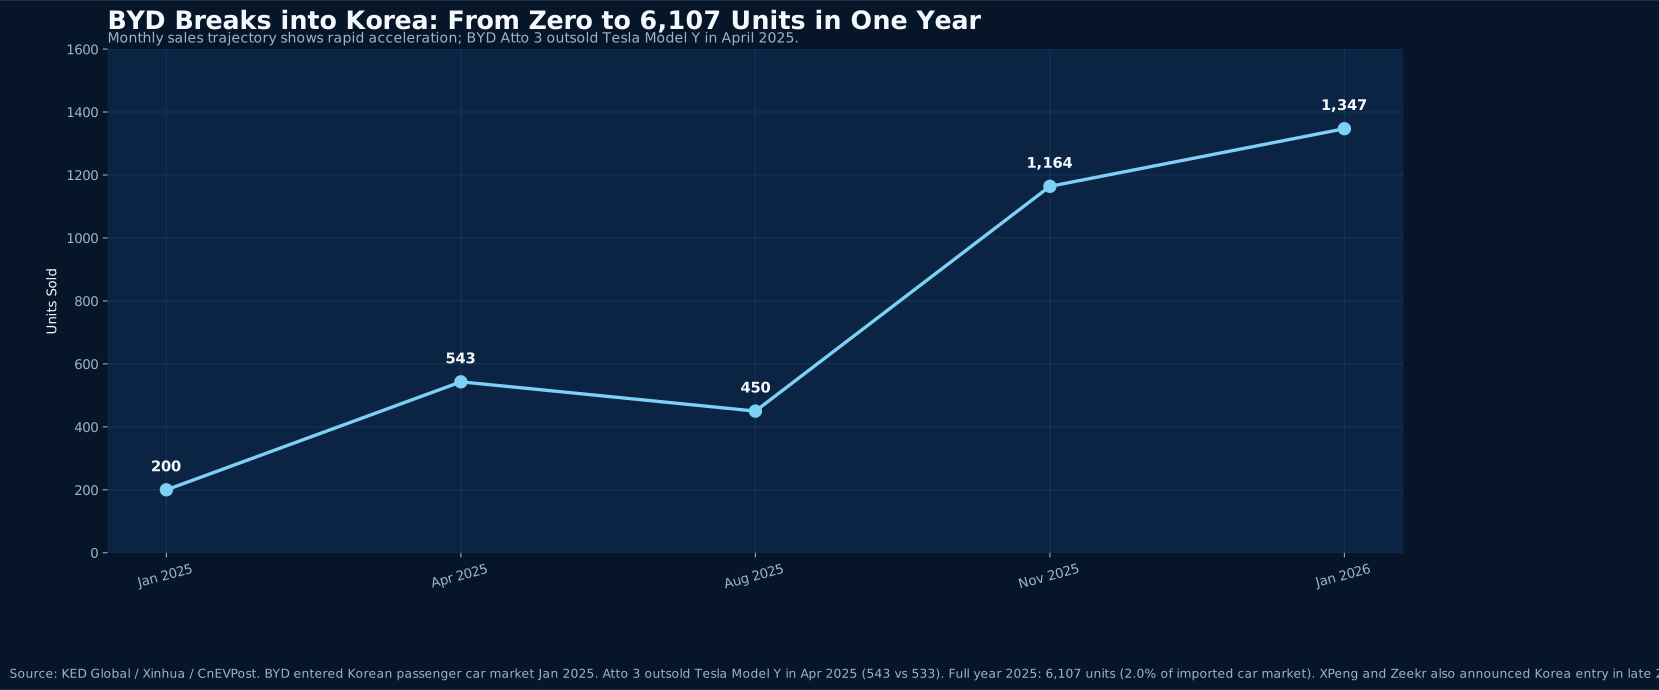
From 2022 to 2025, Chinese EV brands surged from 4.7% to 33.9% market share in South Korea, while domestic Korean EV share fell from 69% to 52%. In Q1 2026, Chinese EV sales in Korea soared 286.1% year-on-year. BYD entered the top two import EV brands in its first year, with Zeekr and XPeng accelerating their market entry.
Read Article
Beauty & Consumer Goods · 2026-04-25
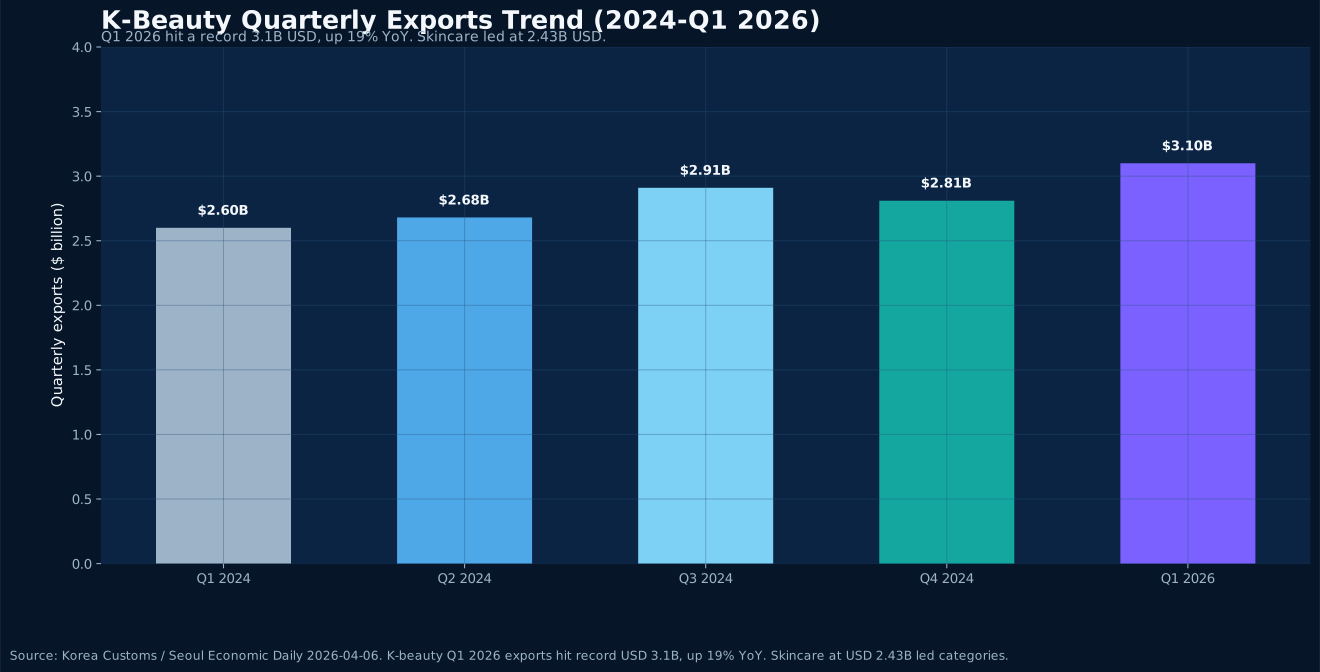
Korea's cosmetics exports hit a record USD 3.1 billion in Q1 2026, up 19% YoY. The US surpassed China as K-beauty's top market at USD 620 million (+40.9%).
Read Article
Cross-Border E-Commerce & Compliance · 2026-04-25
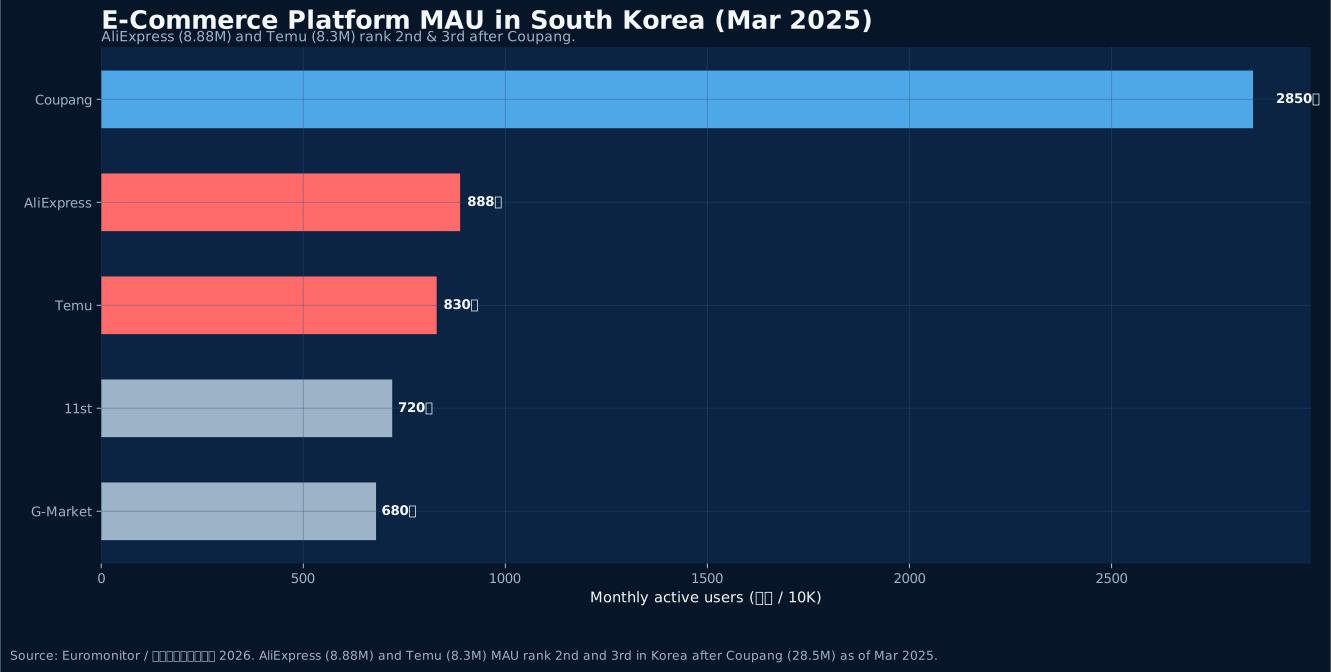
Chinese CBEC platforms account for nearly 50% of Korea's market, with AliExpress and Temu at 8.88M and 8.3M MAU. As global duty-free parcel policies end, 2026 is the 'Year of Compliance.'
Read Article
Semiconductors & Supply Chain · 2026-04-18
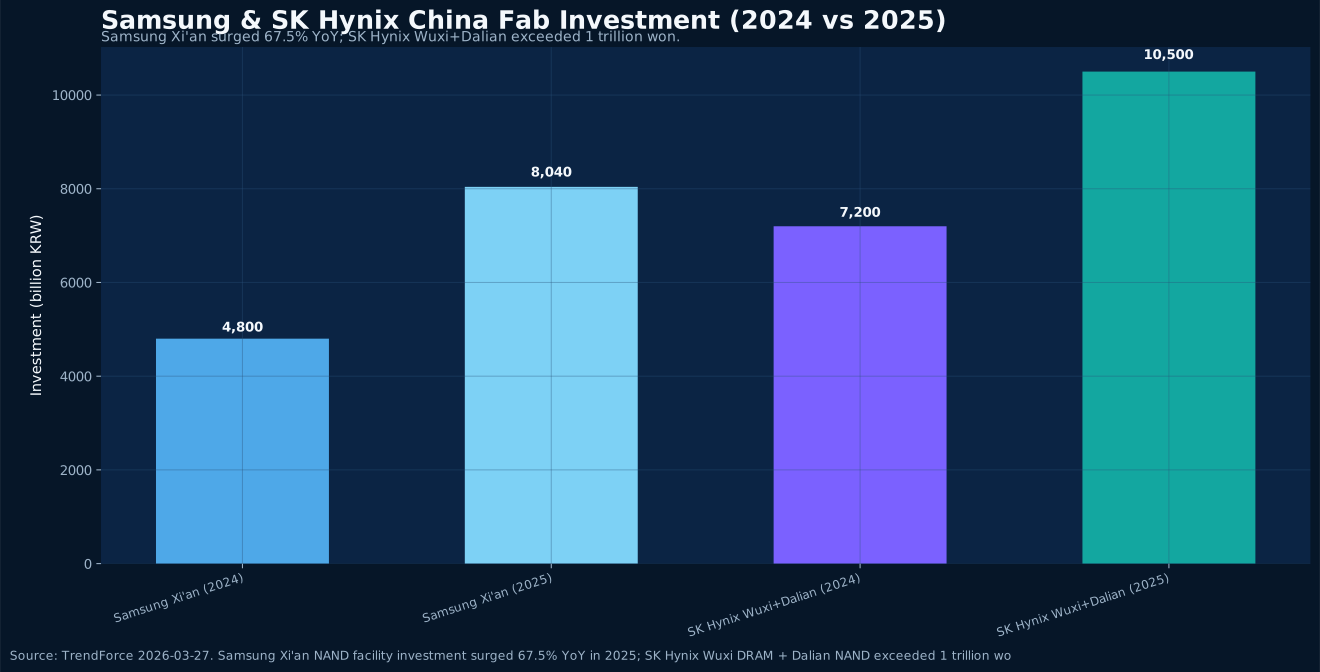
Samsung and SK Hynix face a new export control reality for their China chip fabs. The 2026 annual license system replaces the old waiver, even as both companies sharply boost China investment — Samsung Xi'an up 67.5%, SK Hynix Wuxi+Dalian topping 1 trillion won. We analyze the implications for Korea-China semiconductor trade.
Read Article
Finance & Digital Currency · 2026-04-18
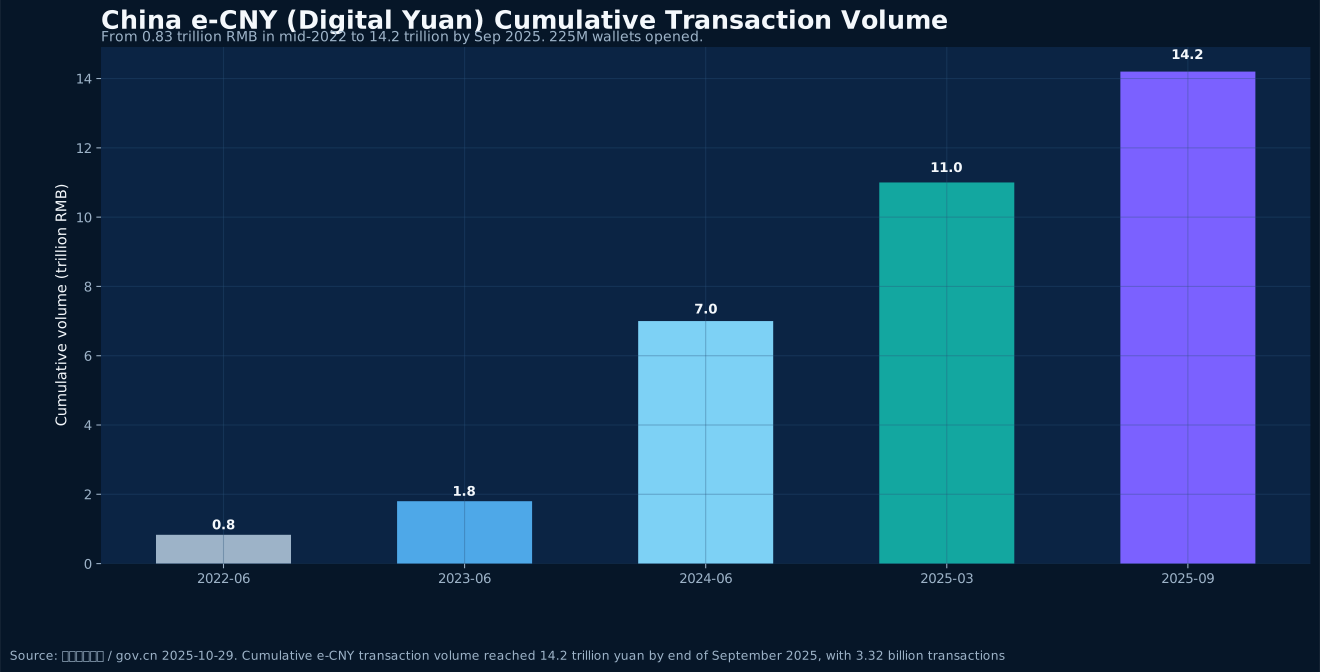
China's digital yuan (e-CNY) has surpassed 14.2 trillion RMB in cumulative transactions with 225 million wallets. Meanwhile, the China-led mBridge cross-border CBDC platform has processed over $55.49 billion — with e-CNY comprising 95%+ of settlement volume. We analyze the implications for Korea-China trade settlement.
Read Article
Cultural Content & IP · 2026-04-18
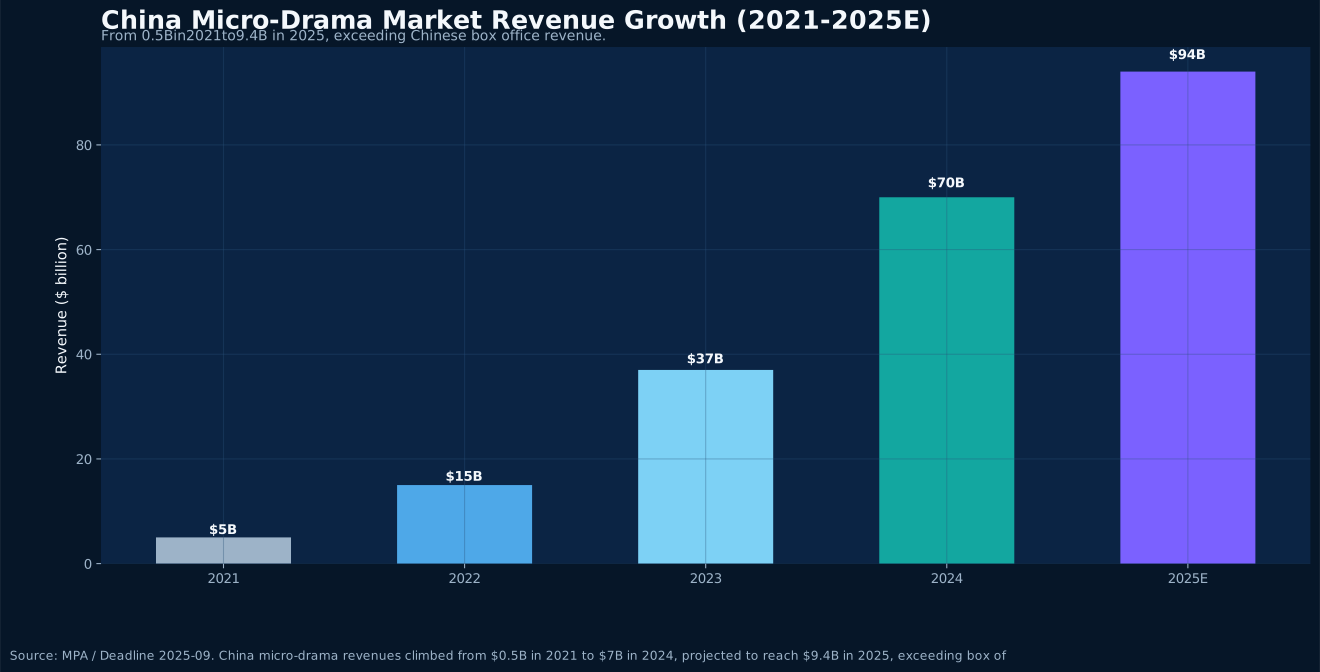
China's micro-drama market revenue surged from $0.5B in 2021 to a projected $9.4B in 2025, set to surpass box office revenue. Meanwhile, Korean short-form drama platforms exploded from 21 to 89 between 2023 and 2025. Chinese platforms like ReelShort and DramaBox are competing and collaborating with Korean production teams on the global stage.
Read Article
Battery Industry · 2026-04-14
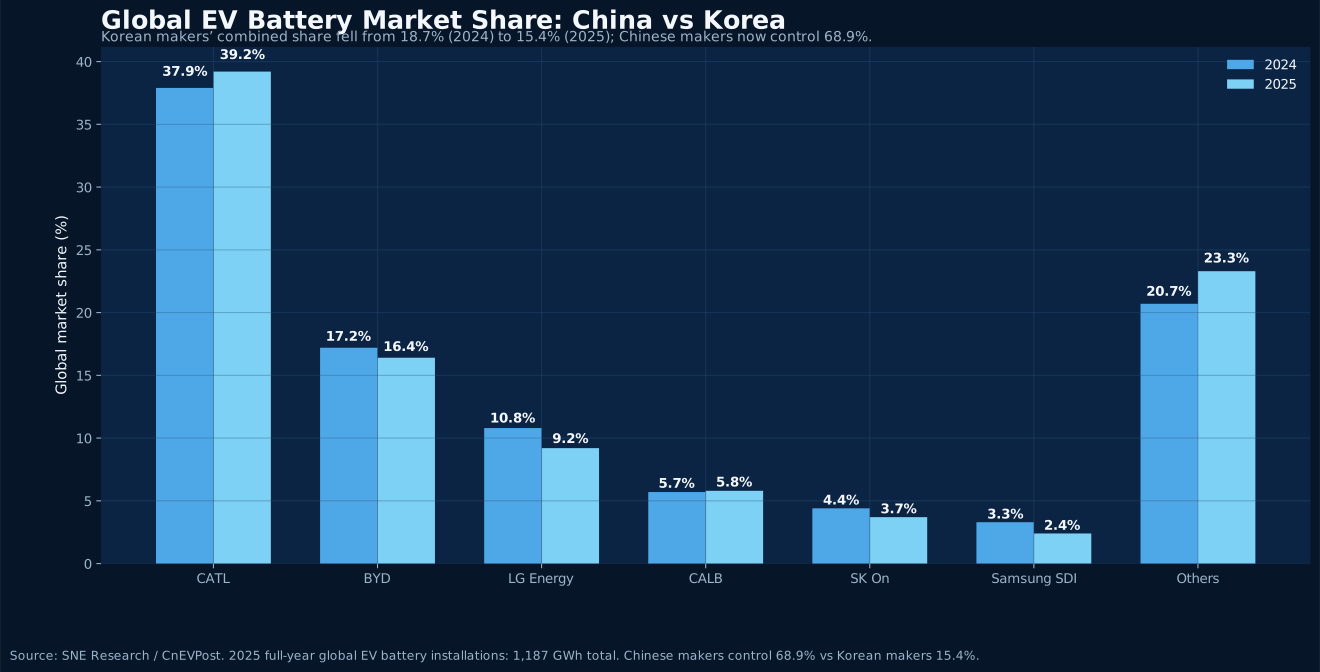
Korean battery makers’ combined global share fell from 18.7% in 2024 to 15.4% in 2025, while Chinese firms claimed 68.9%. With cathode material dependency on China at 80.8%, supply chain restructuring is urgent.
Read Article
Agricultural Trade · 2026-04-14
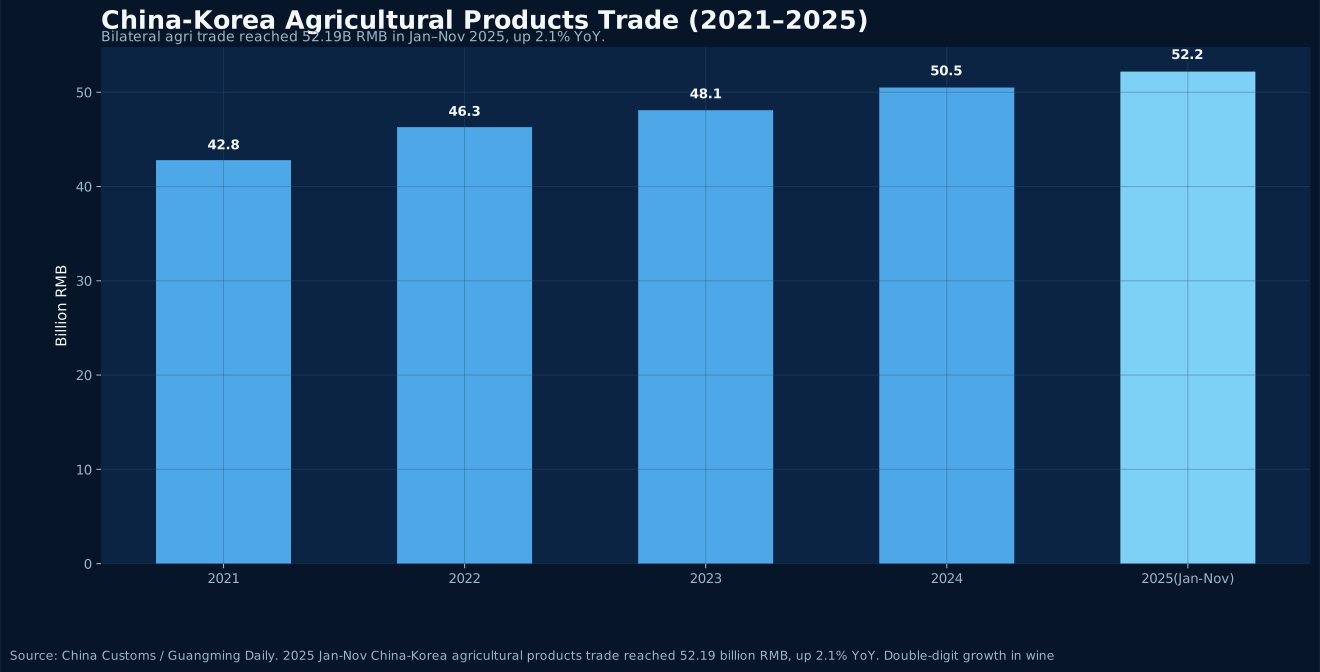
China-Korea agricultural trade reached 52.19 billion RMB in Jan–Nov 2025, up 2.1% YoY. Wine, beverages, dried fruits, and tea showed double-digit growth. China is Korea’s second-largest agricultural supplier.
Read Article
Cold Chain Logistics · 2026-04-14
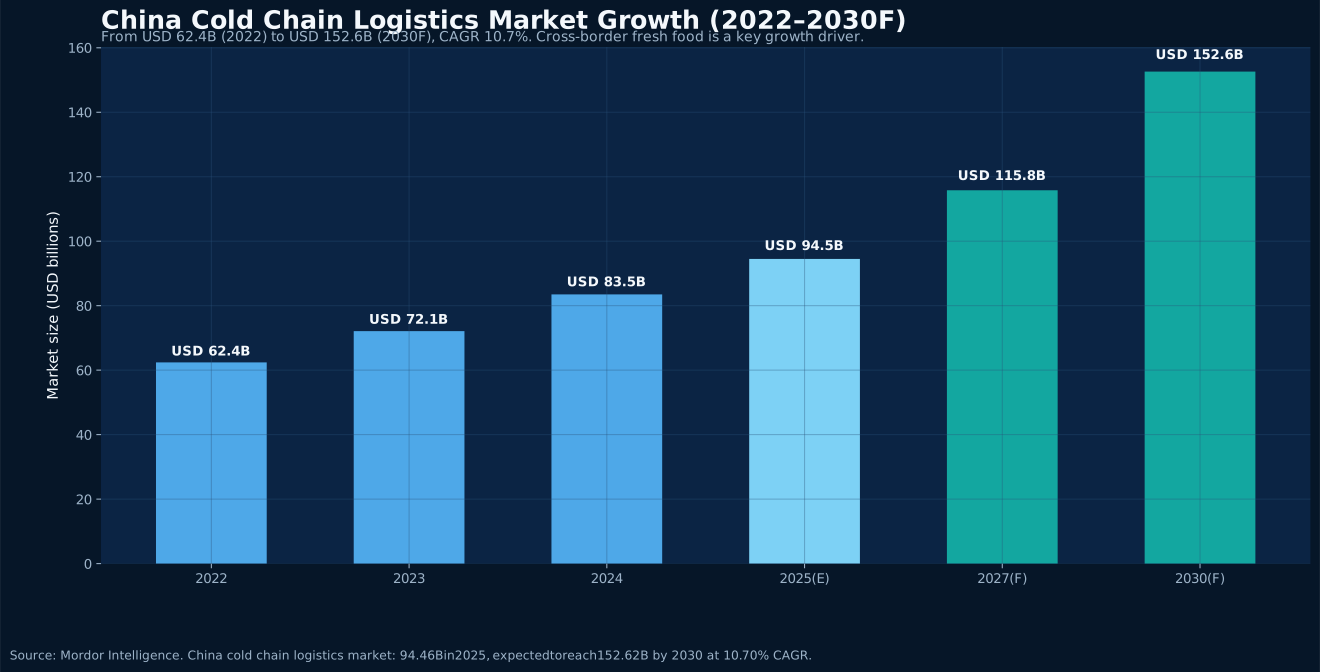
China’s cold chain logistics market reached USD 94.46B in 2025, growing at 10.7% CAGR. China holds 38% of Asia-Pacific share, Korea 9.2%. Cross-border fresh food e-commerce is emerging as a new growth driver for bilateral cold chain cooperation.
Read Article
Livestream E-Commerce · 2026-04-14
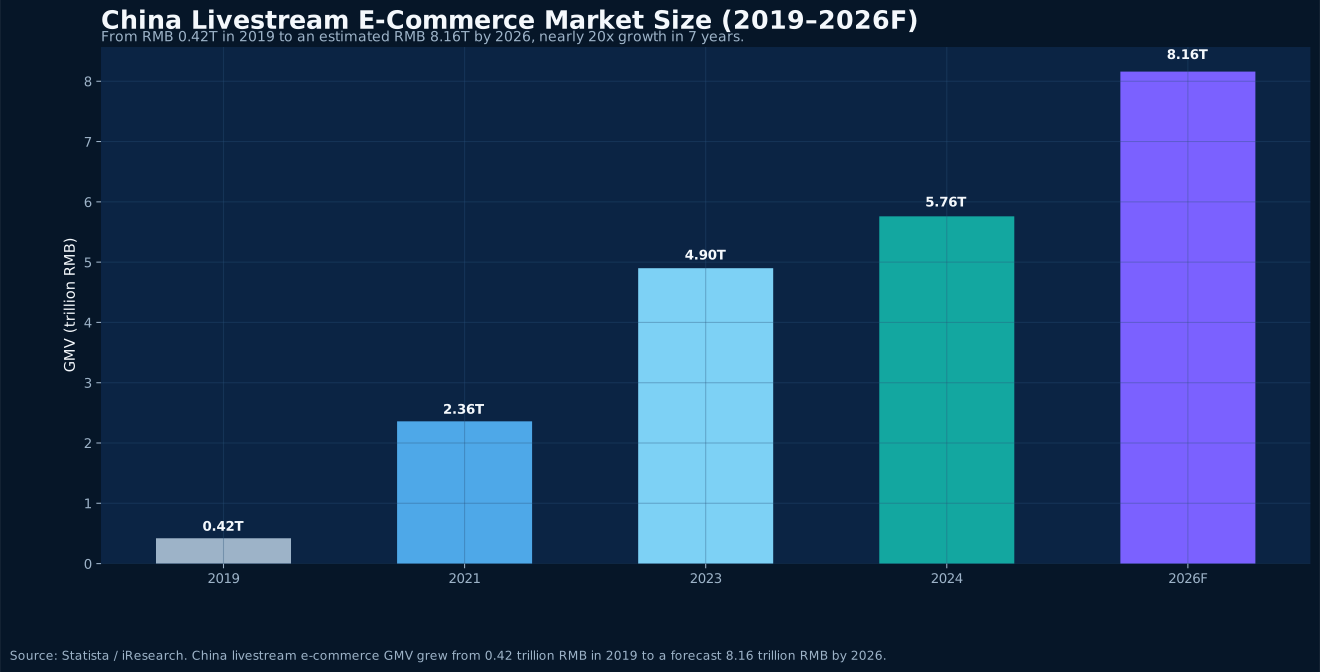
China’s livestream e-commerce market is projected to reach RMB 8.16 trillion by 2026, while 60% of Korean consumers have purchased via live shopping. As both countries tighten regulations, cross-border livestream compliance is becoming a new trade topic.
Read Article
Carbon Border Tax · 2026-04-14
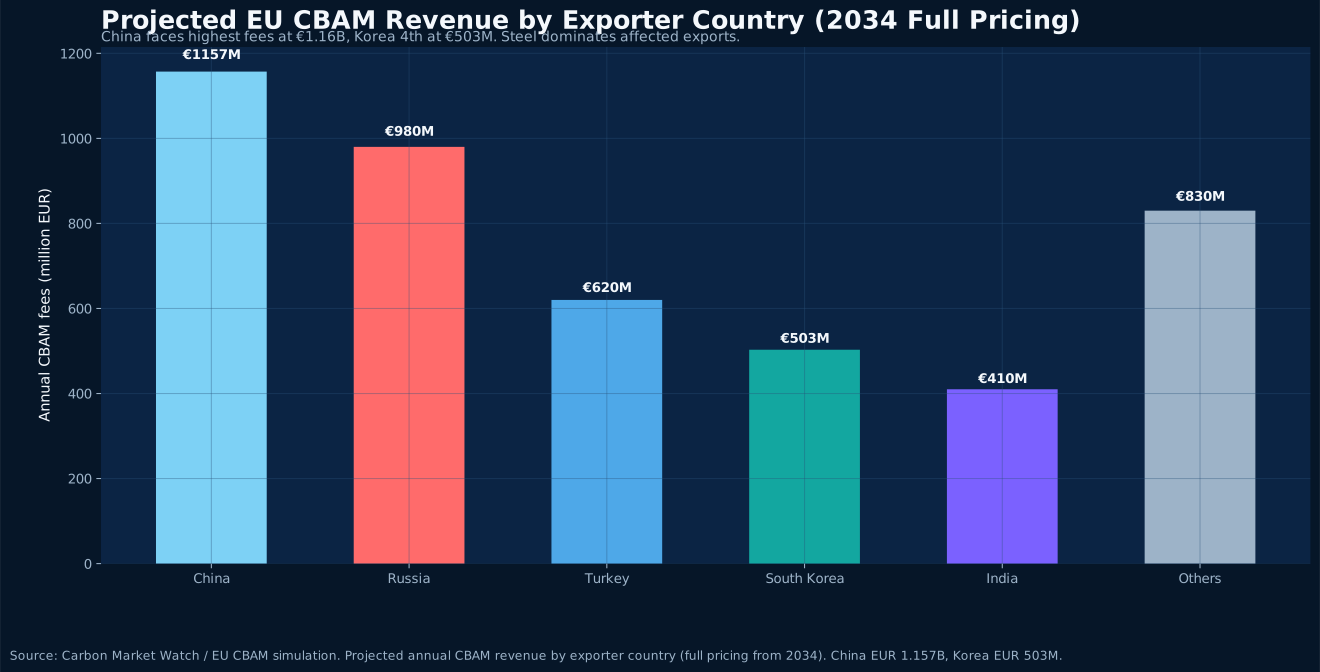
The EU CBAM began levying carbon tariffs in January 2026. Korea’s steel exports to the EU total USD 1.52B, aluminum USD 186M. Under full pricing, Korea faces €503M in annual fees. China-Korea firms face urgent green transition pressure.
Read Article
Robotics & Smart Manufacturing · 2026-04-14
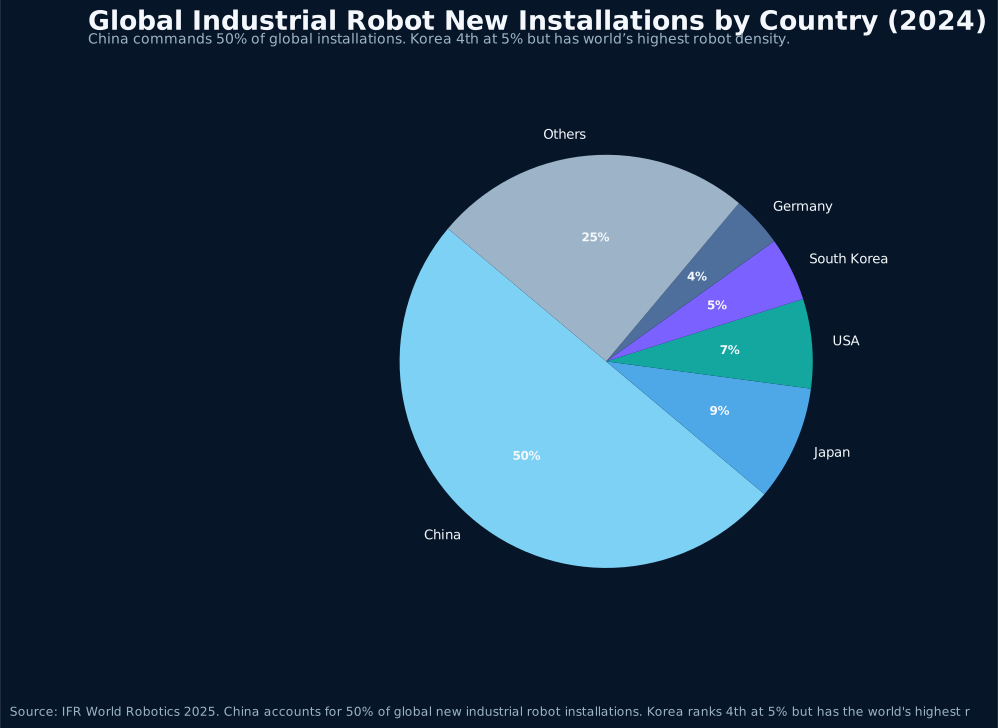
China accounts for 50% of global industrial robot installations; Korea leads in robot density at 1,220 per 10K workers. At AW 2026 in Seoul, China’s Big 5 humanoid robot makers debuted together. China-Korea robotics cooperation is entering a new chapter.
Read Article
Trade Policy · 2026-04-12
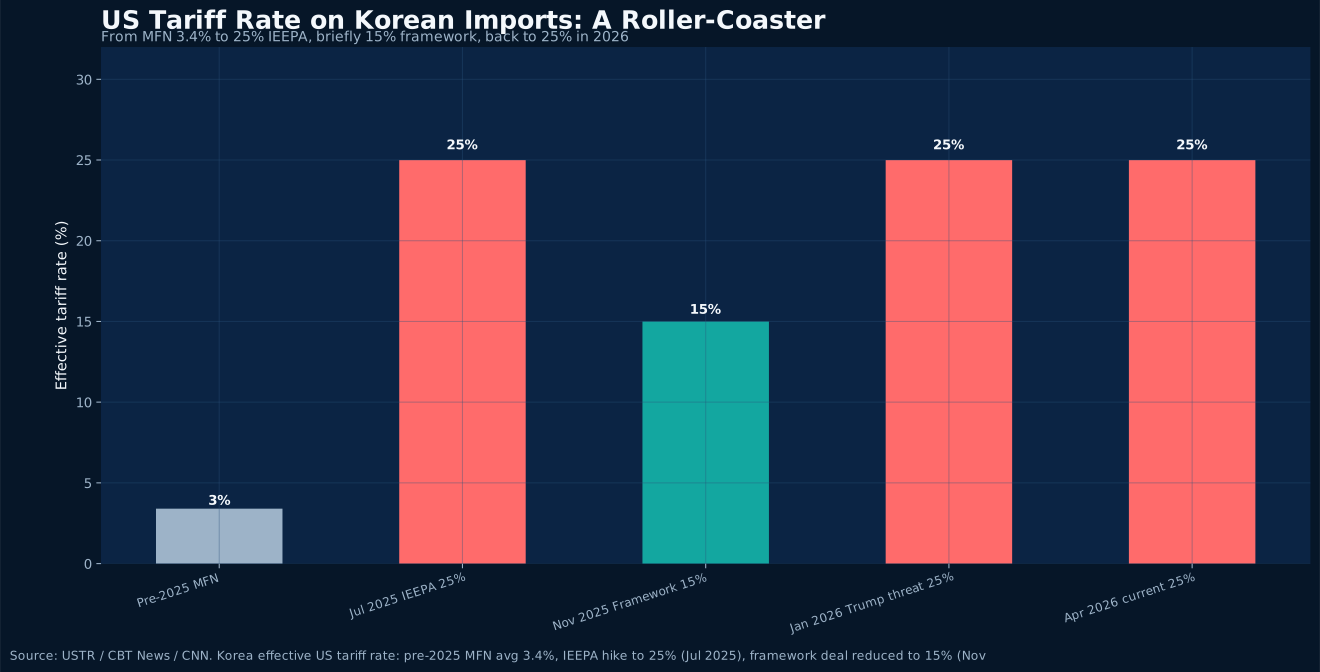
The Trump administration raised Korea tariffs back to 25% in January 2026, forcing Korean conglomerates into simultaneous domestic and US investment surges. This dual-track strategy is fundamentally altering how the China-Korea supply chain operates.
Read Article
Industry Cooperation · 2026-04-12
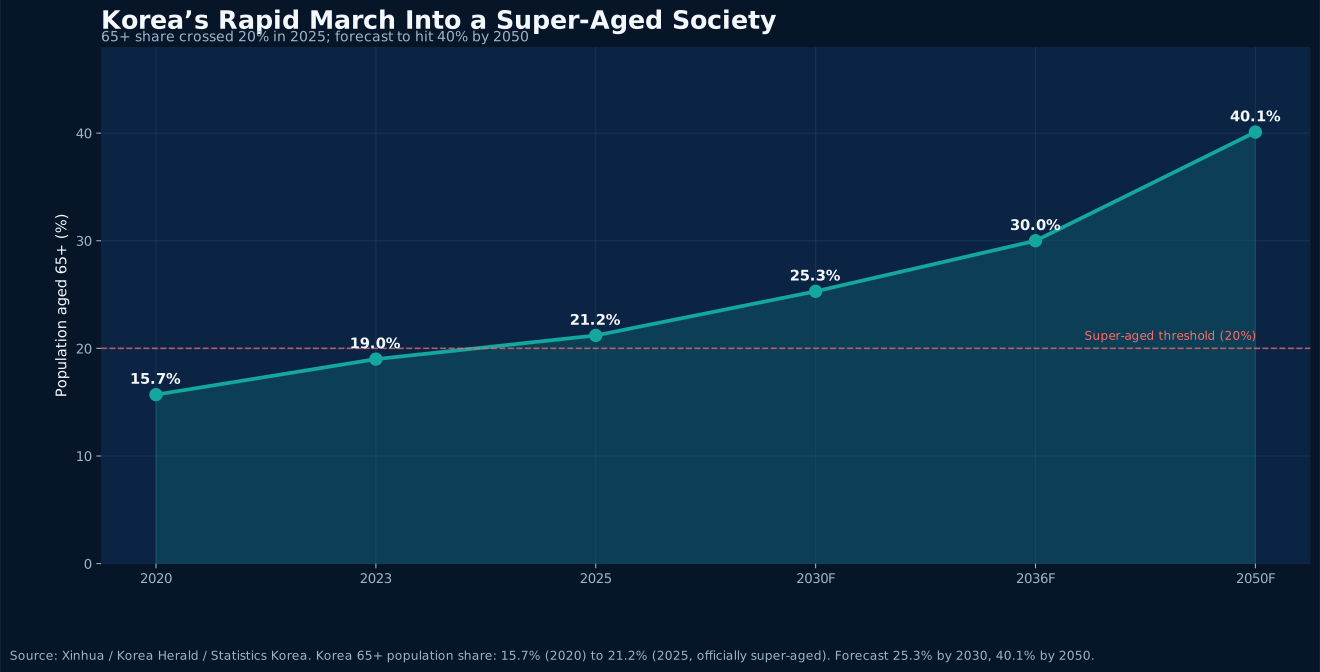
Korea officially became a super-aged society in 2025, while China’s silver economy has reached 7 trillion RMB and is projected to hit 30 trillion by 2035. A cooperation window in elderly-care technology, health management, and age-friendly products between Asia’s two largest economies is rapidly opening.
Read Article
Green Industry · 2026-04-12
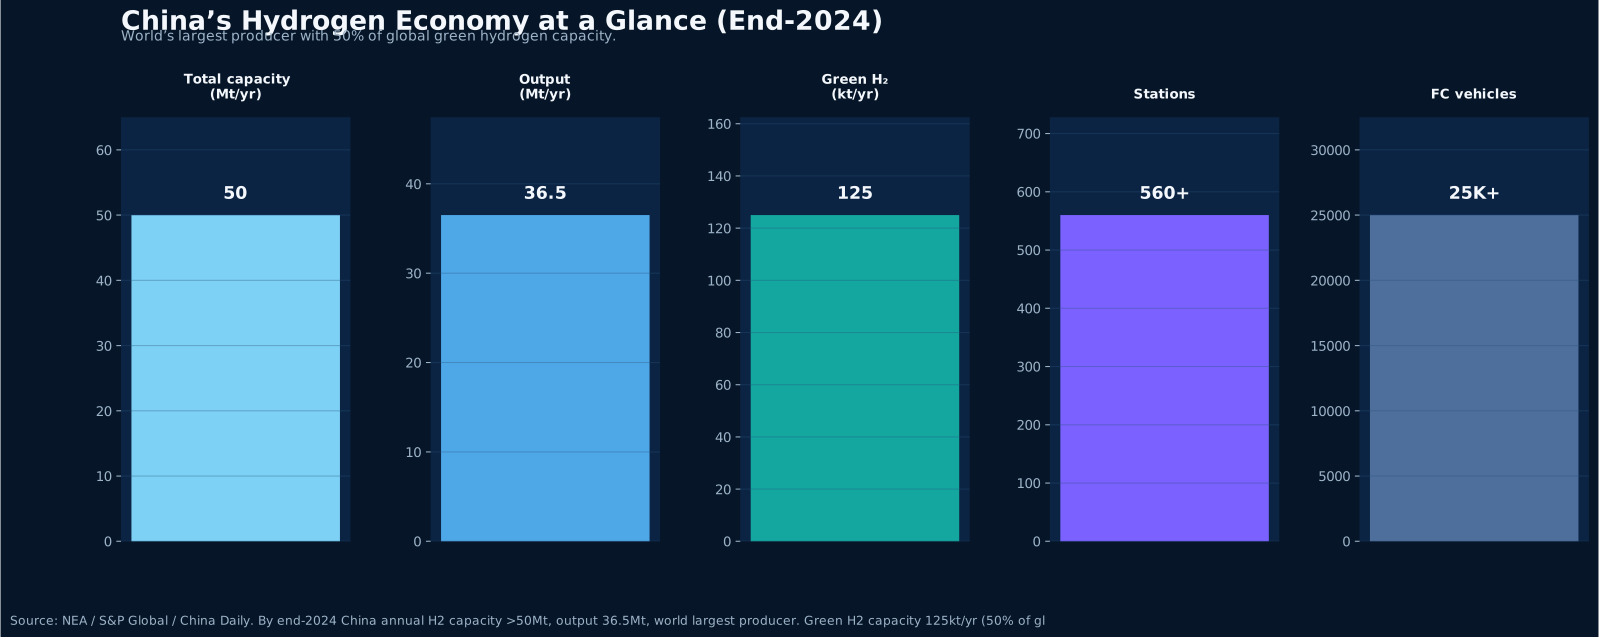
China has built the world’s largest hydrogen production system with over 50 million tons of annual capacity and 50% of global green hydrogen capacity. Korea’s refueling stations doubled from 170 in 2022 to 400 in 2025, with a ~$2.9B hydrogen market. Complementary cooperation across the entire produce-store-transport-use chain is accelerating.
Read Article
Health Industry · 2026-04-11
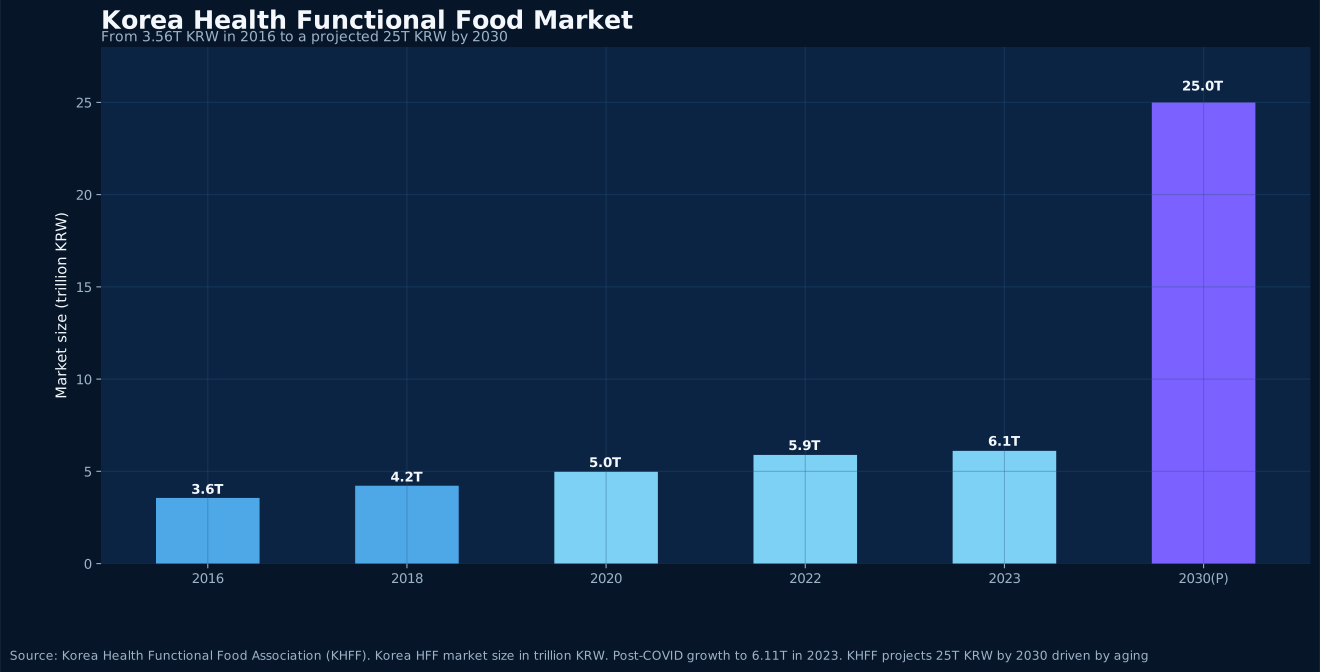
Korea’s health functional food market has surpassed 6 trillion KRW and is projected to reach 25 trillion by 2030. Chinese suppliers have opportunities across ingredients, OEM, and finished goods—but MFDS compliance is non-negotiable.
Read Article
Cultural Trade · 2026-04-11
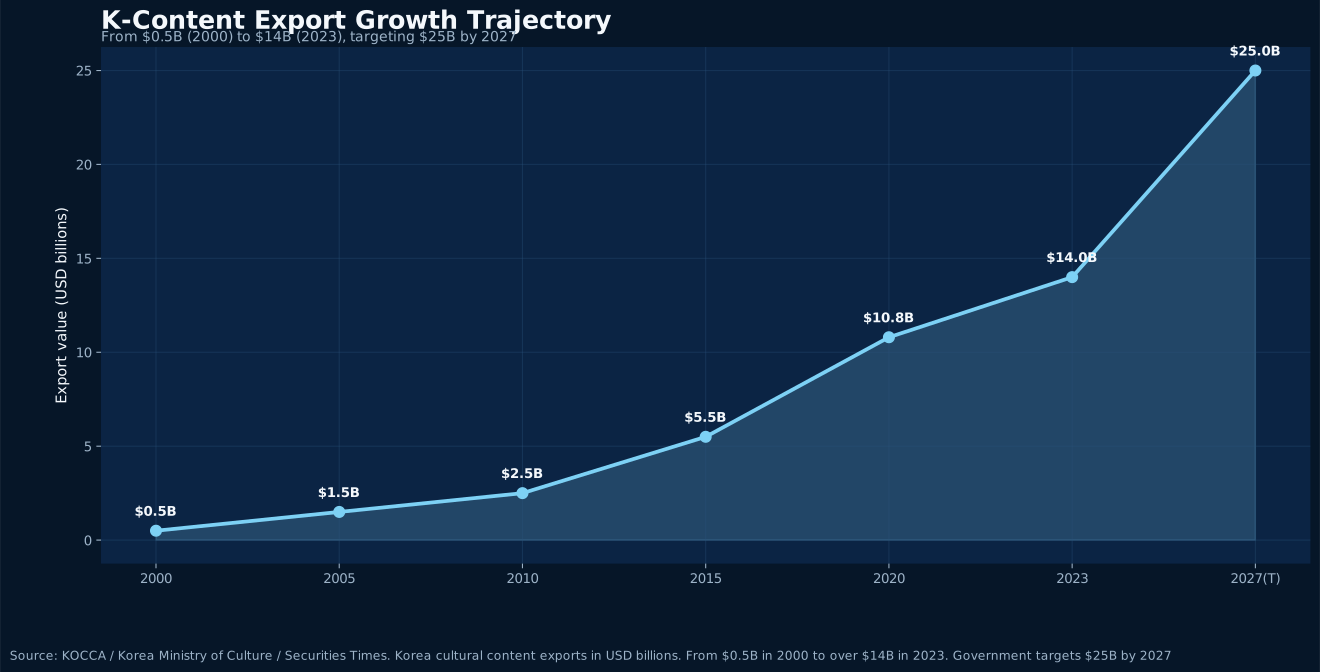
Korea’s cultural content exports have surpassed $14 billion, targeting $25 billion by 2027. China and Japan absorb over 50% of Hallyu exports, but China’s policy environment remains in flux.
Read Article
Tech Industry · 2026-04-11
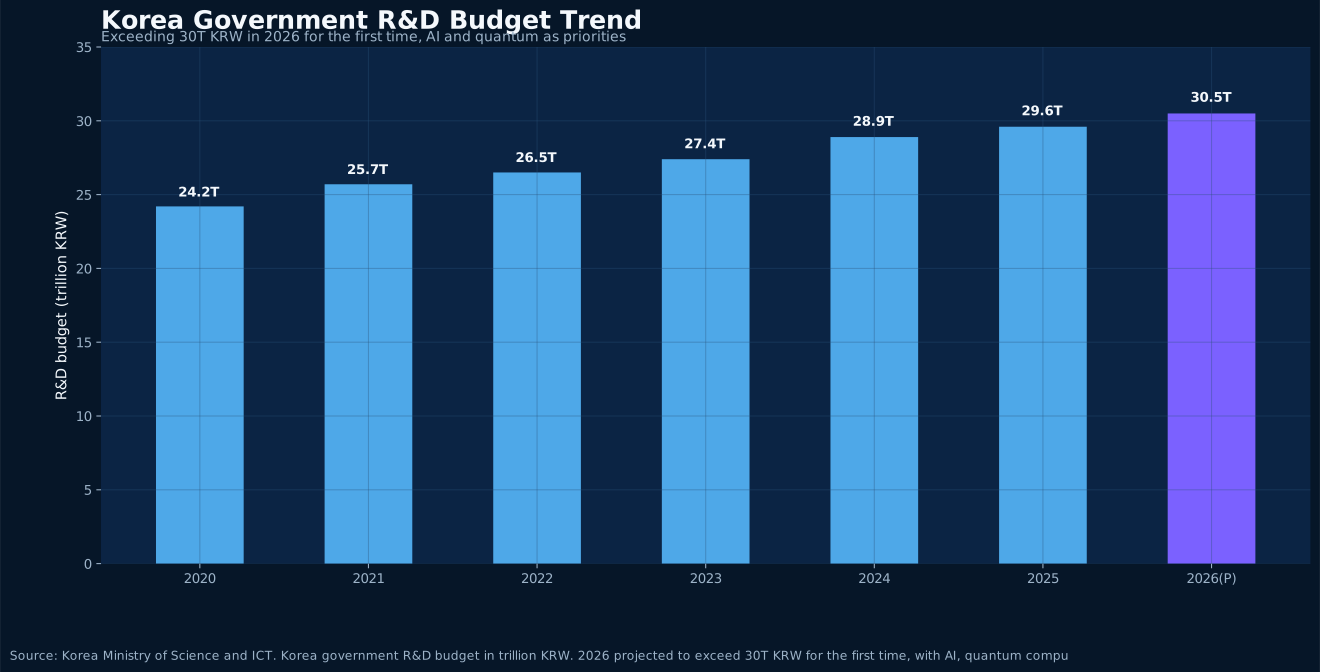
Korea’s 2026 R&D budget exceeds 30 trillion KRW for the first time, with AI and quantum as priorities. China-Korea AI supply chain complementarity is moving from research papers to capital.
Read Article
Policy & Tariffs · 2026-04-10
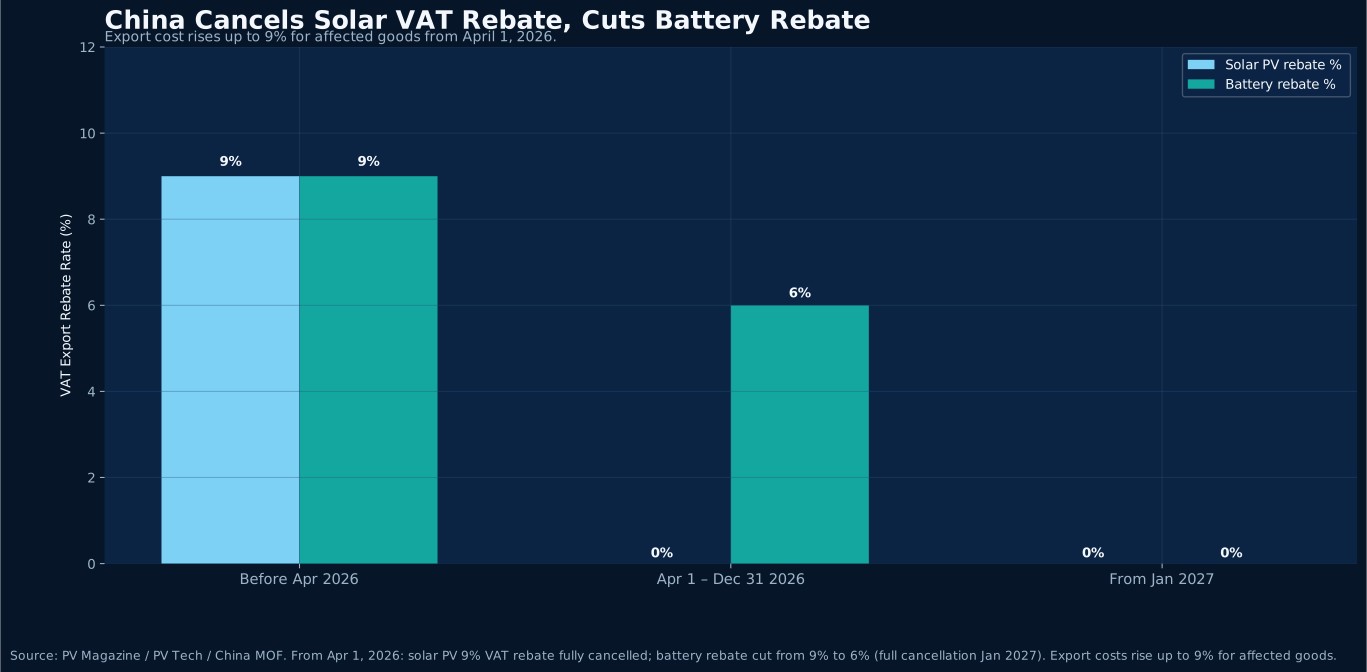
From April 1, 2026, China eliminates the 9% VAT export rebate on solar PV products and cuts battery rebates from 9% to 6% (full phase-out from 2027). Export costs rise up to 9%, reshaping Korea's clean energy supply chain.
Read Article
Cross-Border E-Commerce · 2026-04-10
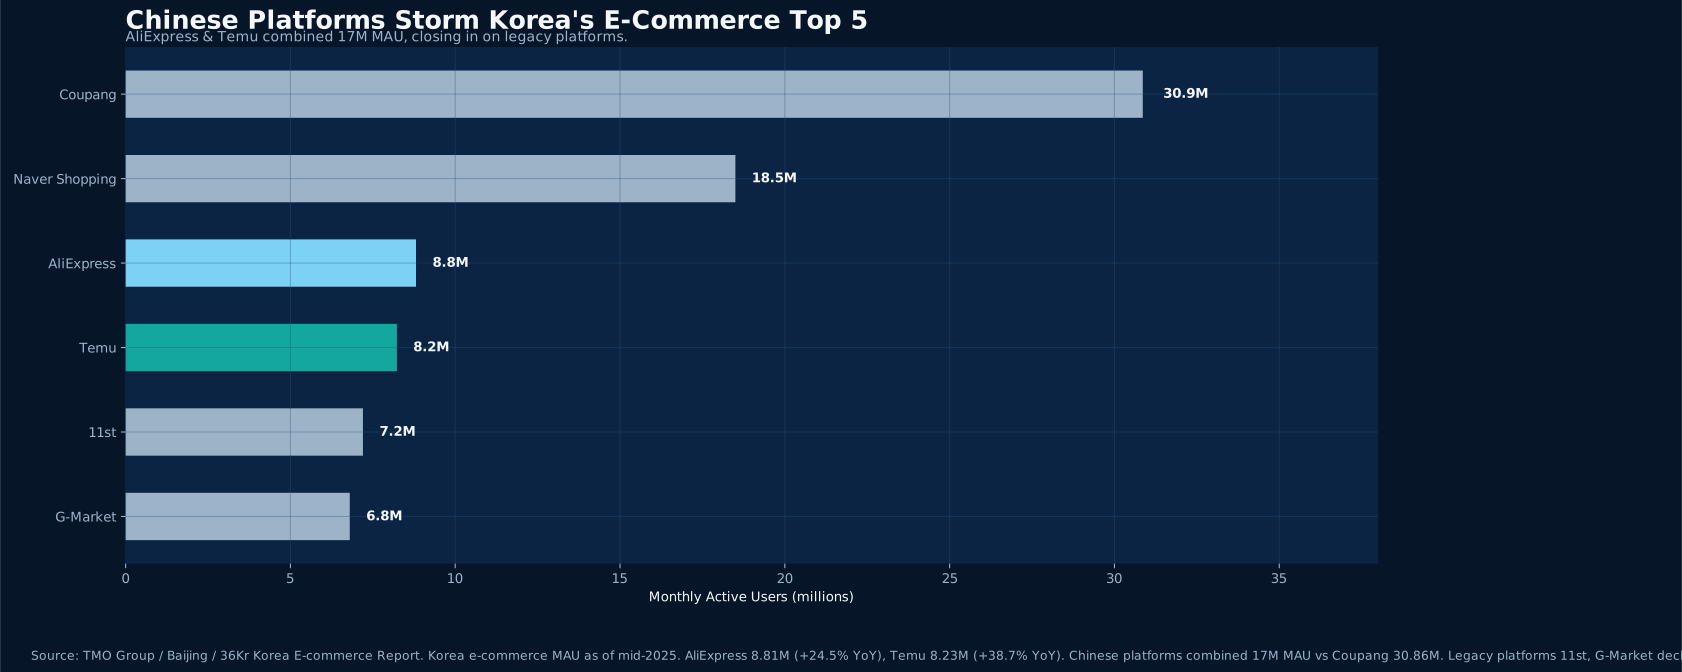
In 2025, AliExpress and Temu reached a combined 17 million MAU in Korea, growing 24.5% and 38.7% YoY respectively. Chinese cross-border e-commerce's share of Korea's overseas direct purchases surged from 41% (2022) to 77% (H1 2025).
Read Article
FTA & Policy · 2026-04-10
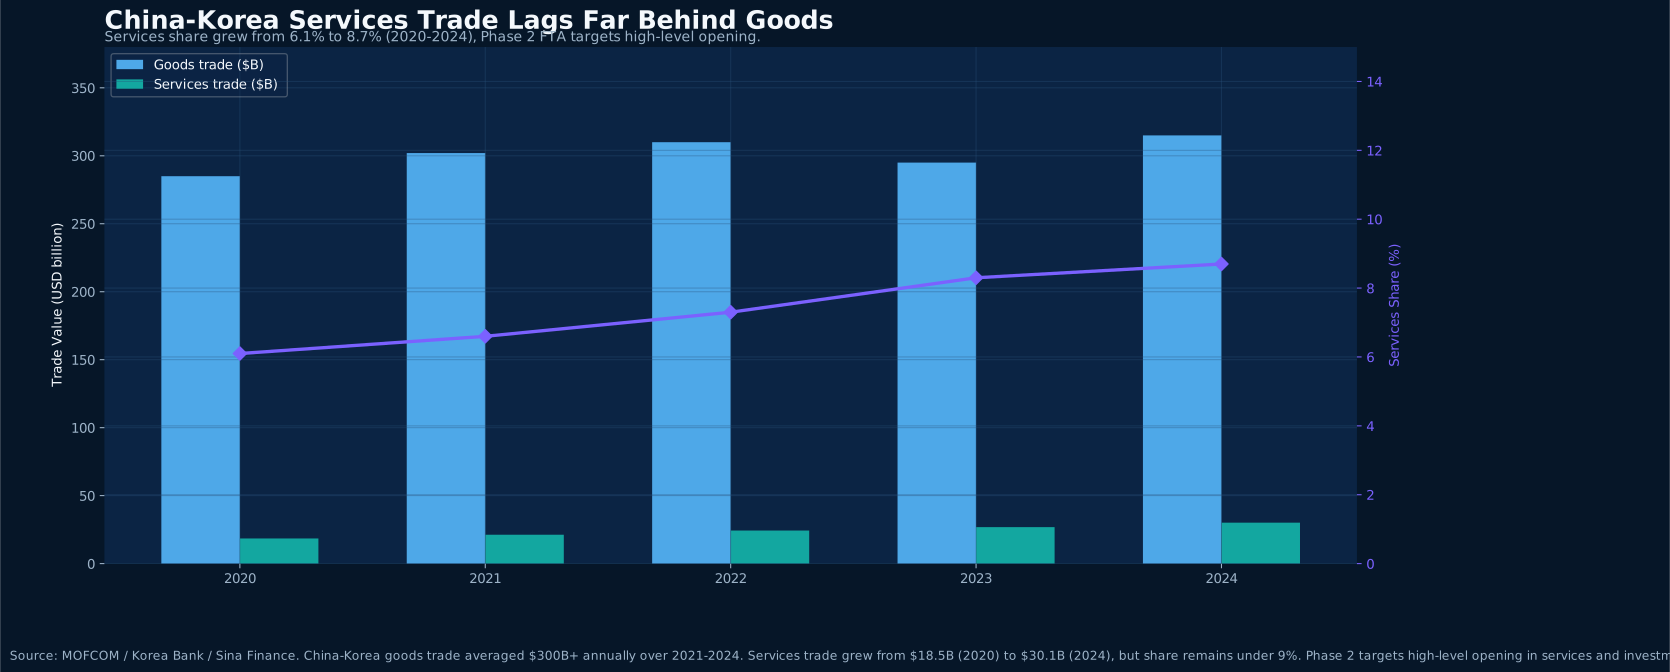
The 13th round of China-Korea FTA Phase 2 negotiations was held in Beijing in January 2026, with deep consultations on cross-border services, investment, and financial services. Leaders agreed to achieve substantial progress within 2026. Services trade accounts for less than 9% of bilateral trade — the opening potential is enormous.
Read Article
Policy & Tariffs · 2026-04-10
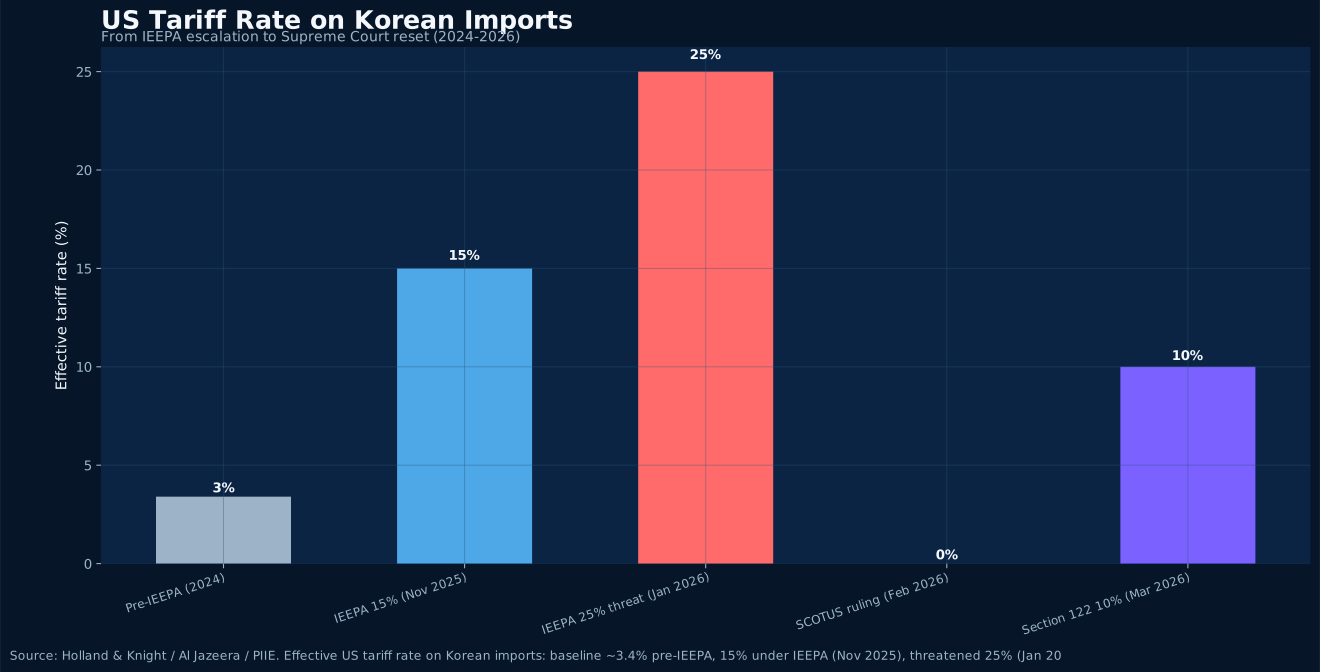
On February 20, 2026, the US Supreme Court ruled 6-3 that IEEPA does not authorize presidential tariffs, invalidating all related executive orders. This landmark decision reshapes not only US-Korea trade law but introduces new variables for China-Korea commerce. We trace the full arc from IEEPA escalation to judicial reset and analyze impacts on supply chains, cross-border e-commerce, and exporters.
Read Article
Cross-Border E-Commerce · 2026-04-10
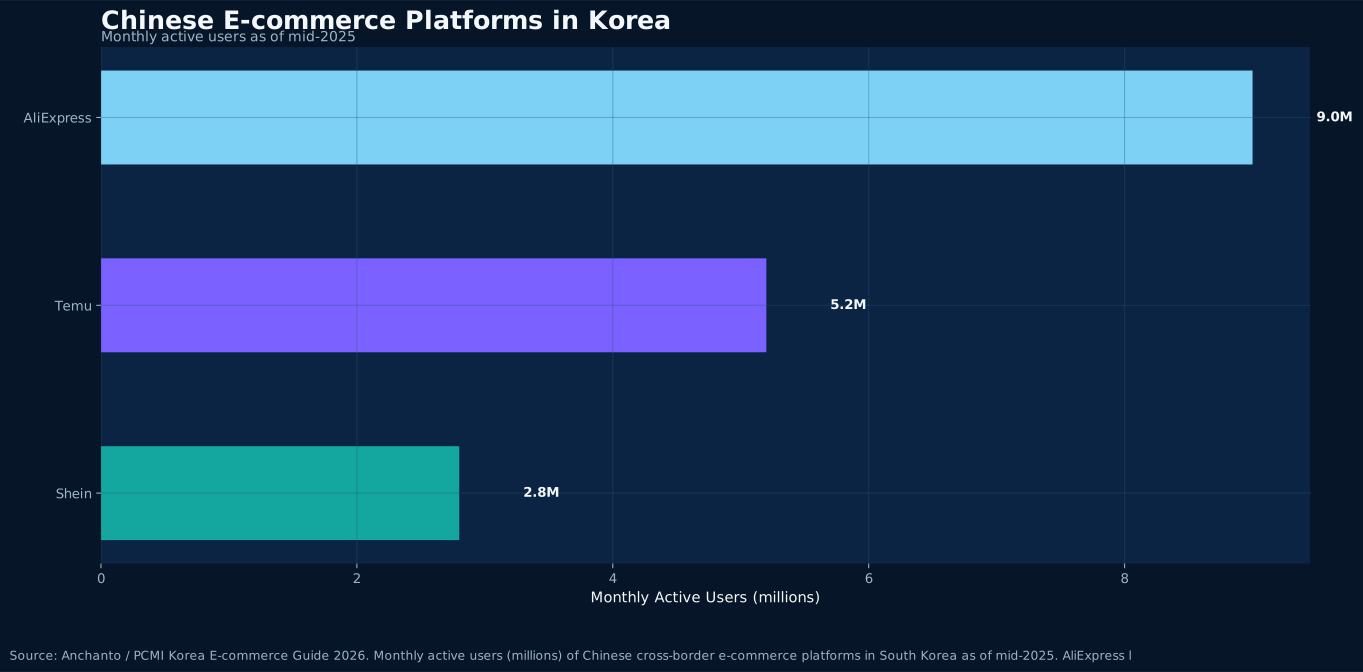
Korean consumers spent $3.1 billion on Chinese e-commerce platforms in 2024, an 84% YoY surge. AliExpress leads with 9 million monthly active users, followed by Temu and SHEIN. This China-platform-led cross-border wave is fundamentally changing Korea's retail competition, logistics infrastructure demands, and the microstructure of China-Korea trade.
Read Article
Beauty Insight · 2026-04-10
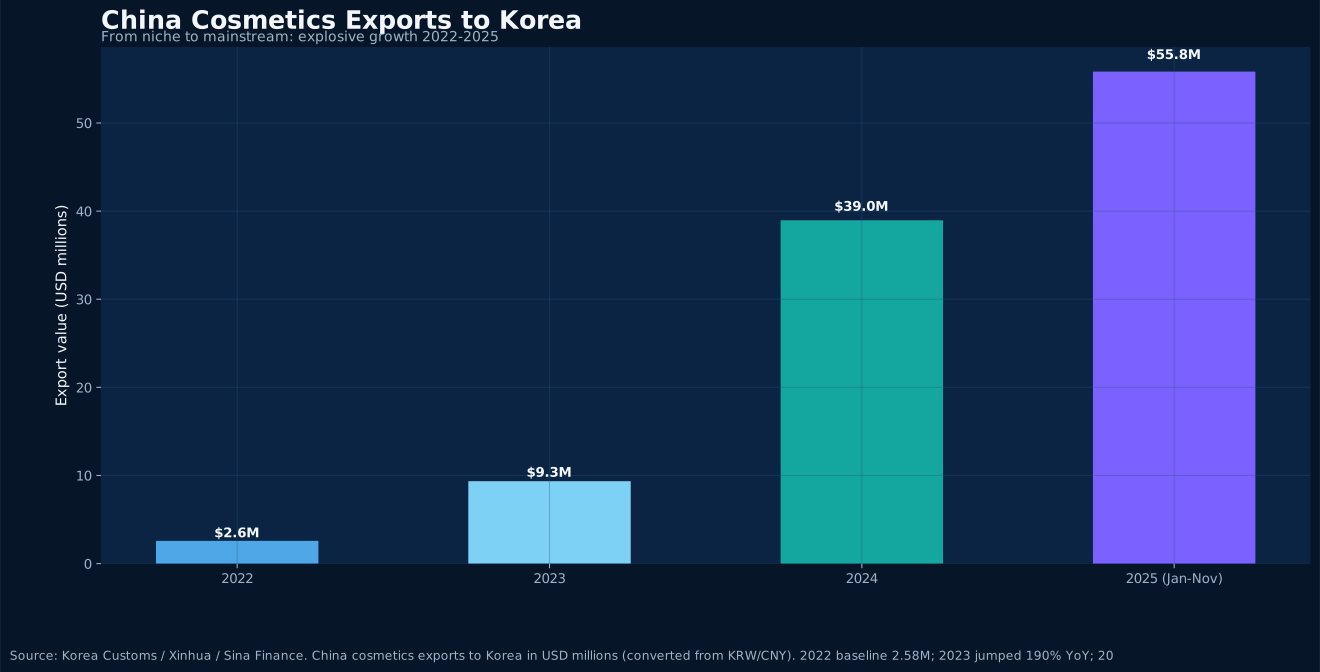
In the first 11 months of 2025, China's cosmetics exports to Korea reached $55.83 million, surpassing all of 2024. Korean consumers' cross-border purchases of Chinese cosmetics hit $155 million in Q1-Q3 2025, up 39.6% YoY. The China-Korea beauty trade — once defined by K-beauty's dominance — is undergoing a quiet role reversal.
Read Article
Petrochemical Insight · 2026-04-09
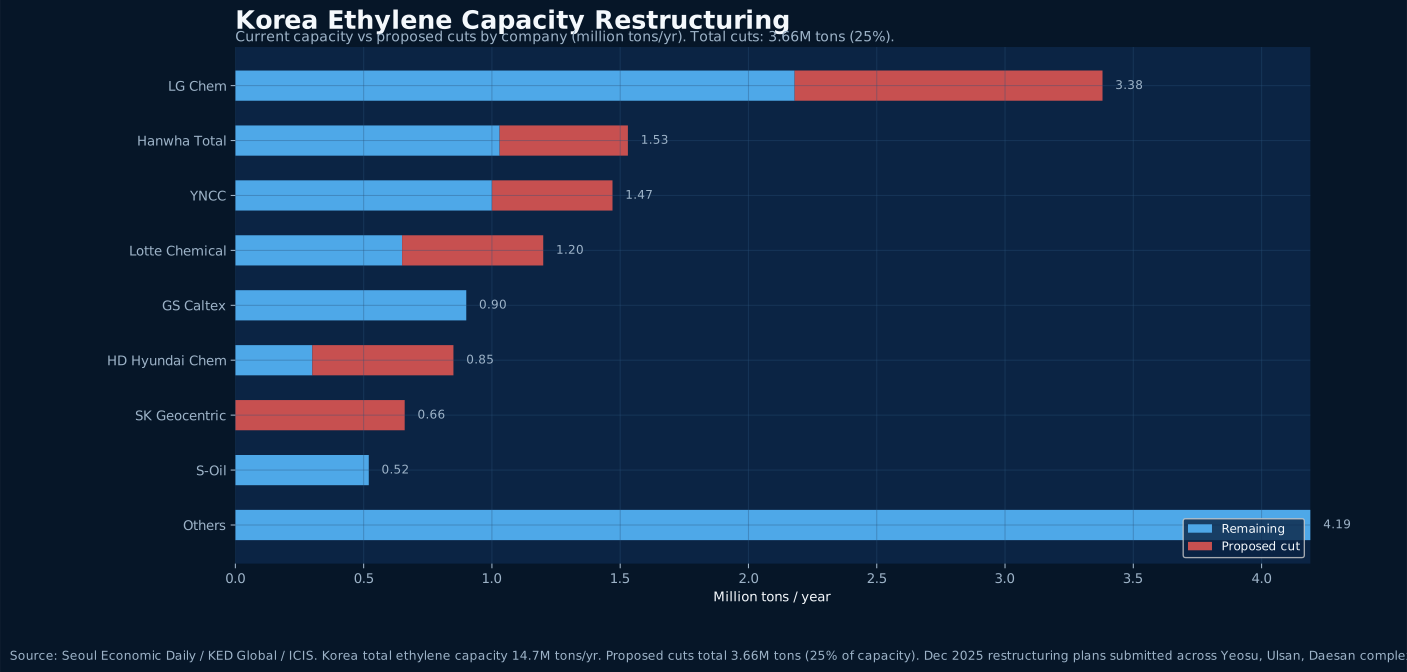
Facing China’s massive petrochemical capacity expansion, Korea’s petrochemical industry is undergoing its most severe structural adjustment in two decades. Export volumes fell to 12.3M tons in 2024, and ten major firms submitted plans to cut 3.66M tons of ethylene capacity.
Read Article
Shipbuilding Insight · 2026-04-09
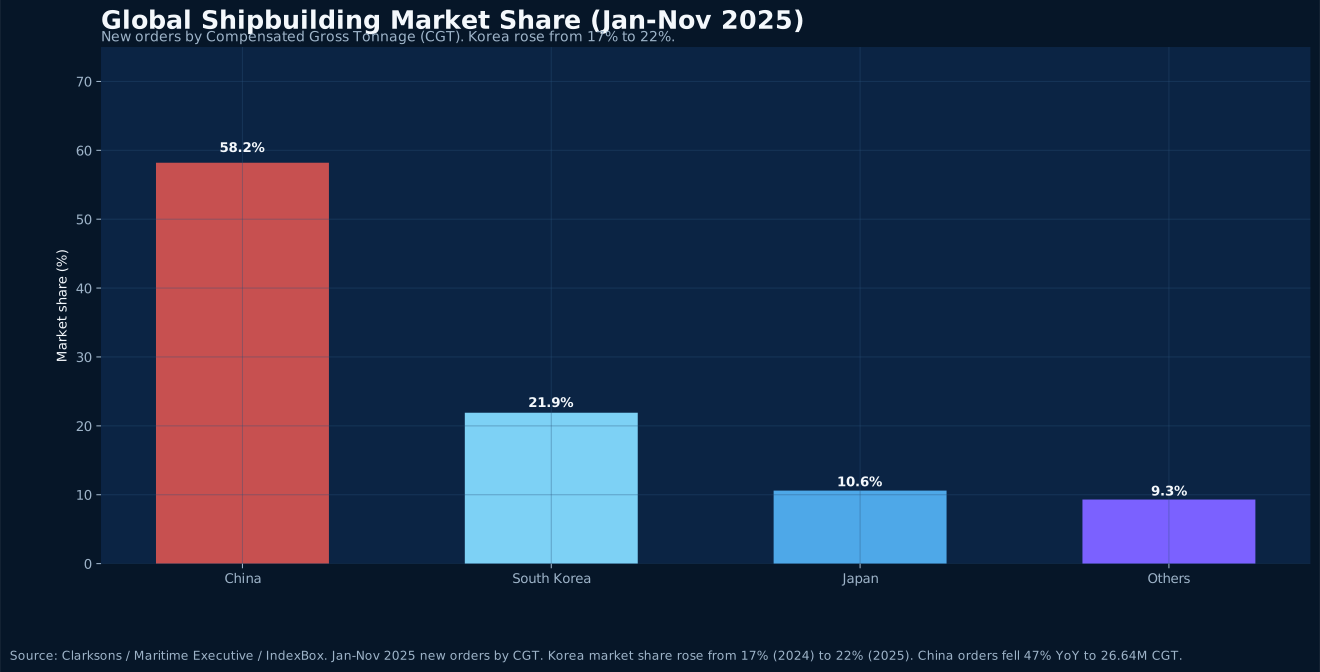
Korea’s shipbuilding market share rose from 17% in 2024 to 22% in 2025, and it captured 88% of global LNG carrier orders. China wins on volume, Korea wins on unit value—the competitive dynamics are shifting profoundly.
Read Article
Seafood Insight · 2026-04-09
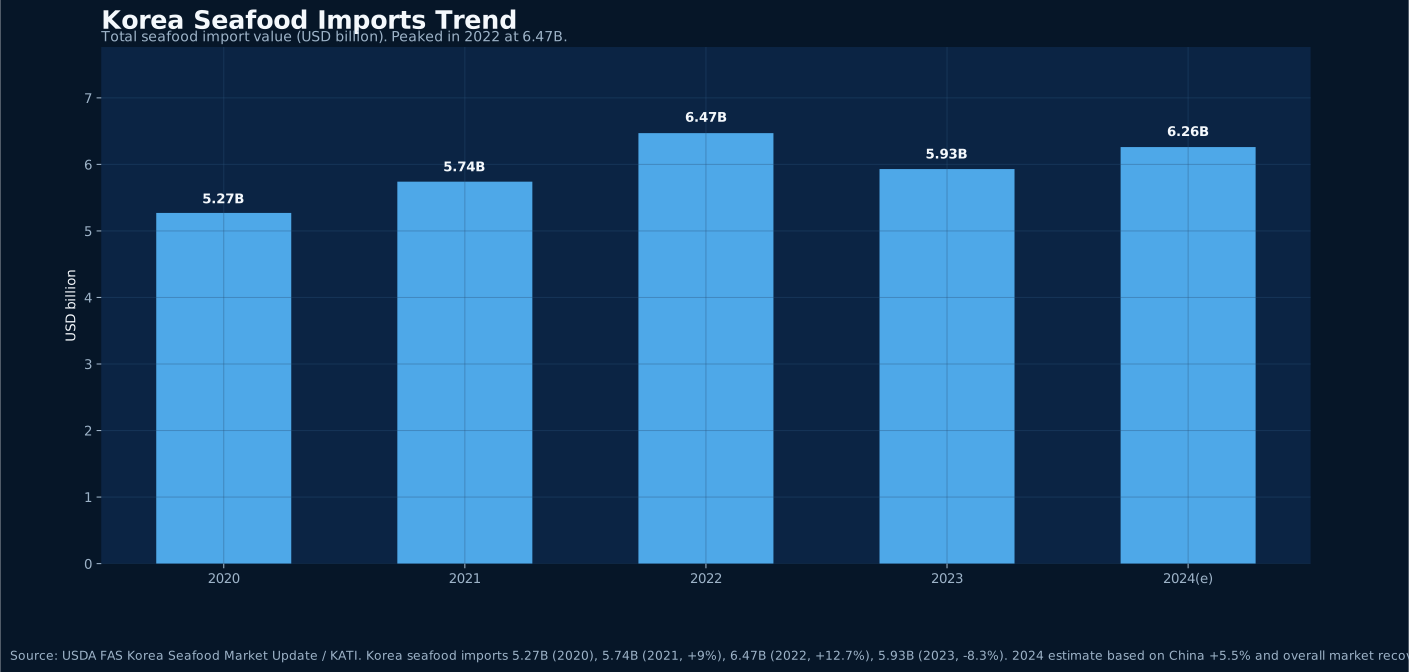
Korea’s seafood imports exceed 6 billion USD, with China overtaking Russia in 2023 as the top supplier. As Korea’s domestic production continues to decline and aquaculture accounts for over 62%, the China-Korea seafood trade structure is undergoing a profound shift.
Read Article
Tourism Trade Insight · 2026-04-09
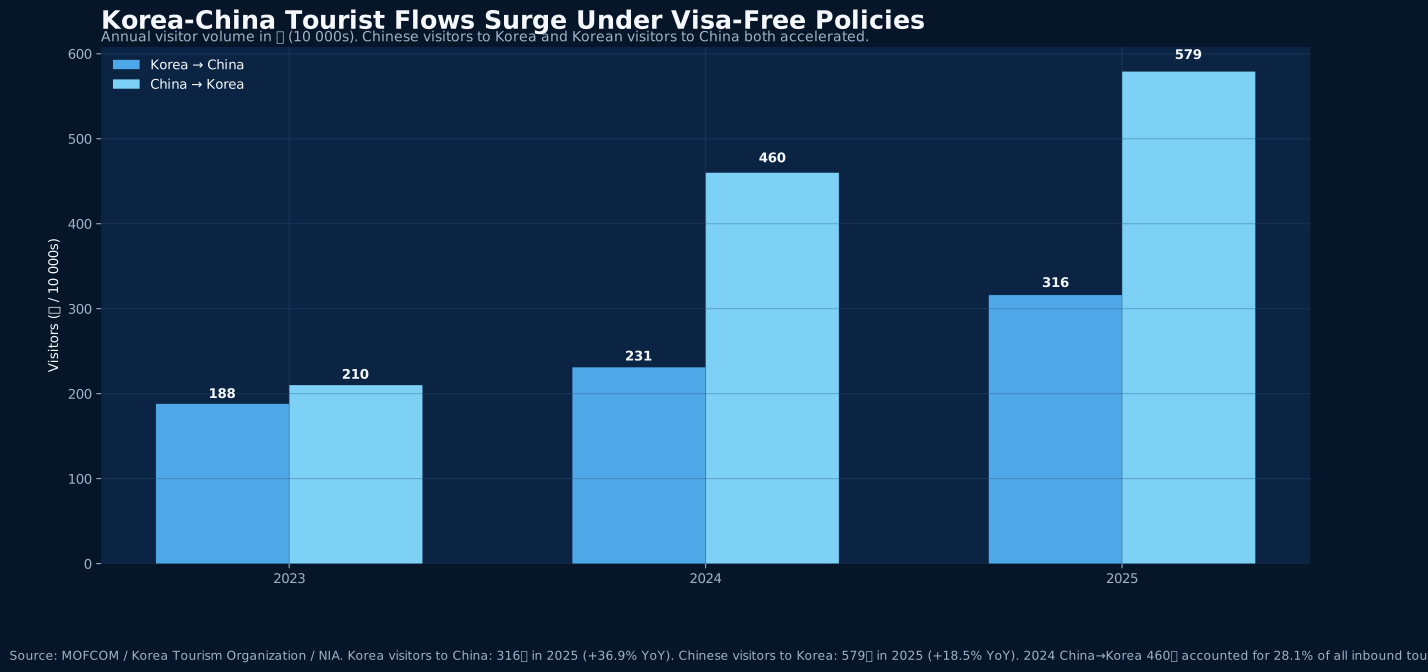
Korean visitors to China hit 3.16 million in 2025 (+36.9% YoY) while Chinese visitors to Korea reached 5.79 million (+18.5%). Visa-free policies are driving a shift from duty-free shopping toward experience-led consumption.
Read Article
Biotech Insight · 2026-04-09
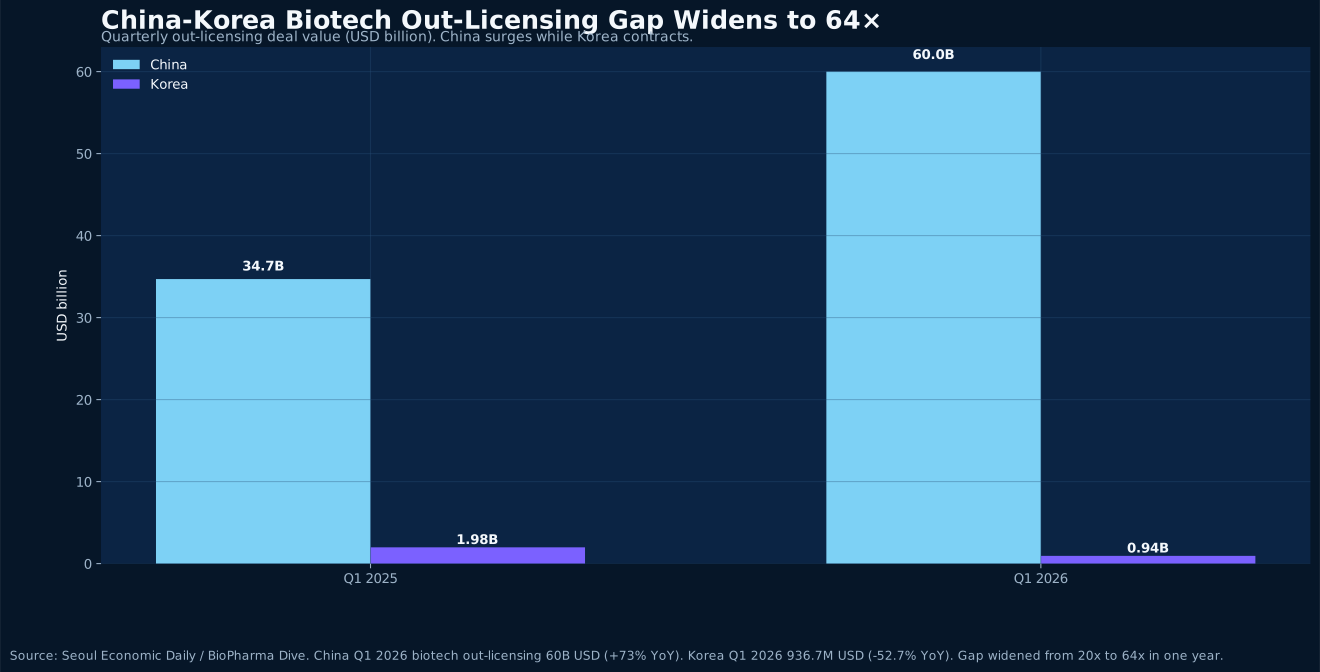
In Q1 2026, China’s biotech out-licensing deals totaled USD 60 billion (+73% YoY), while Korea managed just USD 937 million (−52.7%). The technology export gap widened from 20× to 64× in a single year as Chinese innovative drugs reshape the global biopharma landscape at unprecedented speed.
Read Article
Biopharma Insight · 2026-04-09
China's biotech out-licensing value climbed to USD 60 billion in Q1 2026 while Korea fell below USD 1 billion. What looks like a capital-market gap is also forcing Korean firms to reassess China-facing market access, expo strategy, BD channels, and partnership timing.
Read Article
Game Export Insight · 2026-04-09
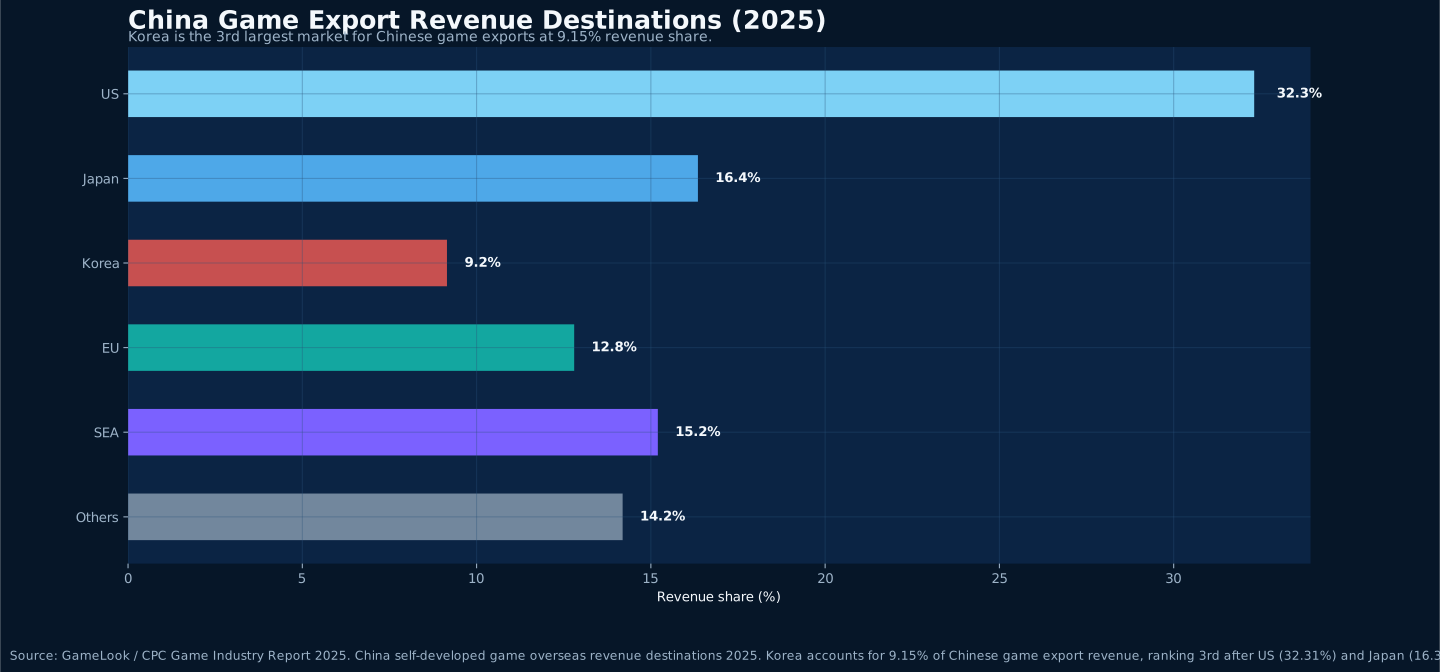
Korea accounted for 9.15% of revenue destinations for Chinese self-developed game exports in 2025, ranking behind only the U.S. and Japan. At the same time, Korea's game market is still expanding and mobile continues to gain share. The real barrier is no longer market entry itself, but whether localization, compliance disclosure, and operating rhythm can be executed together.
Read Article
Digital Economy Insight · 2026-04-09
Korea is now the third-largest market for Chinese game exports, accounting for 9.15% of overseas revenue from China-developed games. As Korea abolishes pre-release game censorship and tightens loot-box regulations, Chinese developers face both new opportunities and new challenges in a reshaped regulatory landscape.
Read Article
Semiconductor & Chips · 2026-04-08
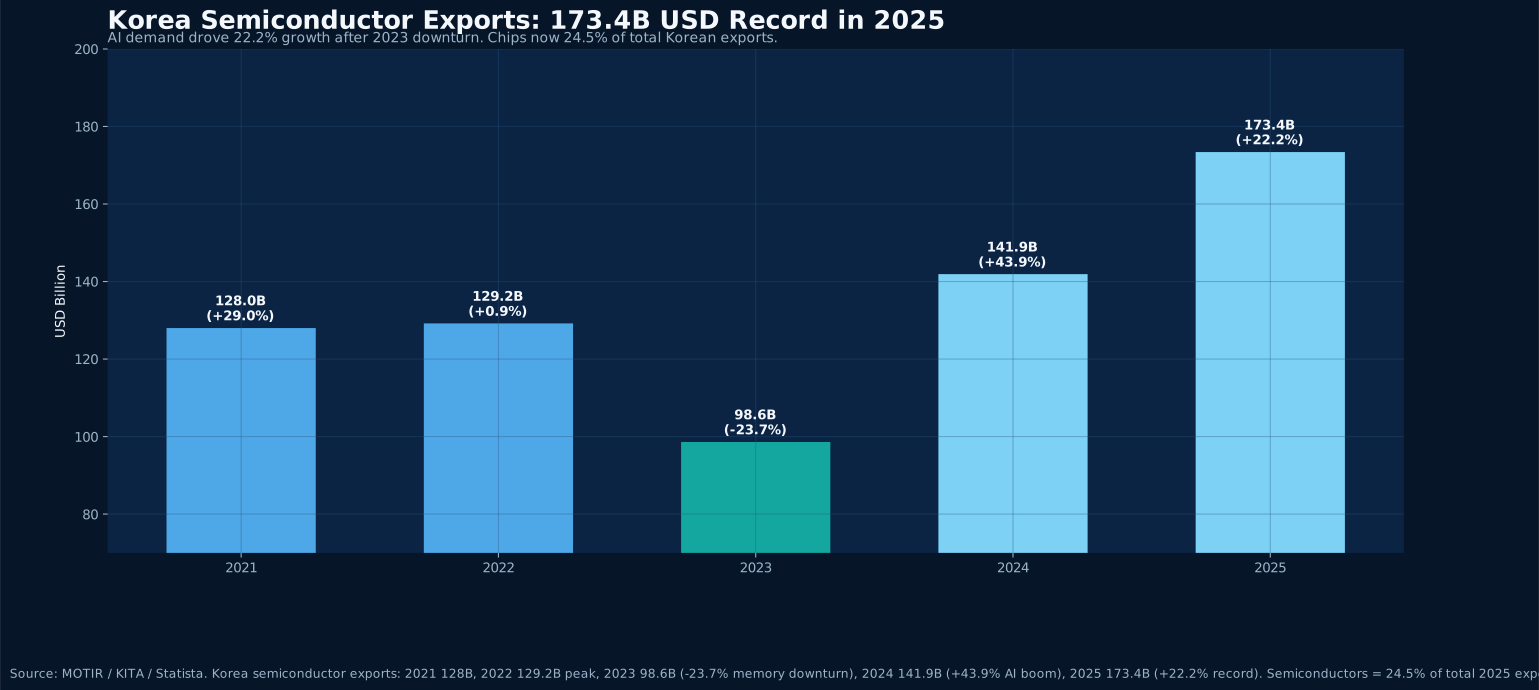
Korea's 2025 semiconductor exports reached $173.4B (+22.2%), accounting for 24.5% of total exports. China remains the #1 destination (32.8%), but export controls and supply chain shifts are reshaping the landscape.
Read Article
Textile & Apparel · 2026-04-08
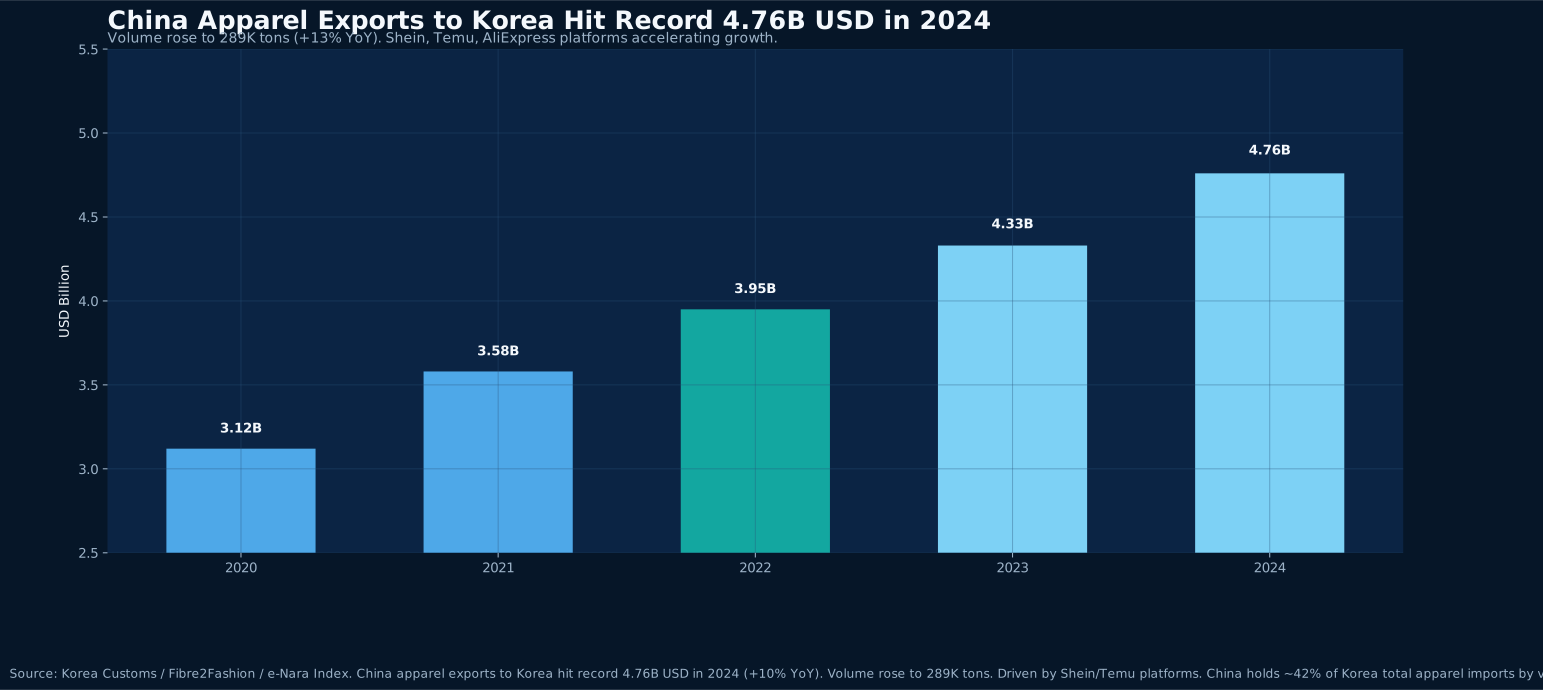
China's apparel exports to Korea hit a record $4.76B in 2024 (+10% YoY), while Korea's domestic textile production shrank from 28.5T KRW (2021) to 22.5T (2024). Temu's MAU surpassed 7.21 million, disrupting Korea's fashion retail landscape.
Read Article
Medical Devices · 2026-04-08
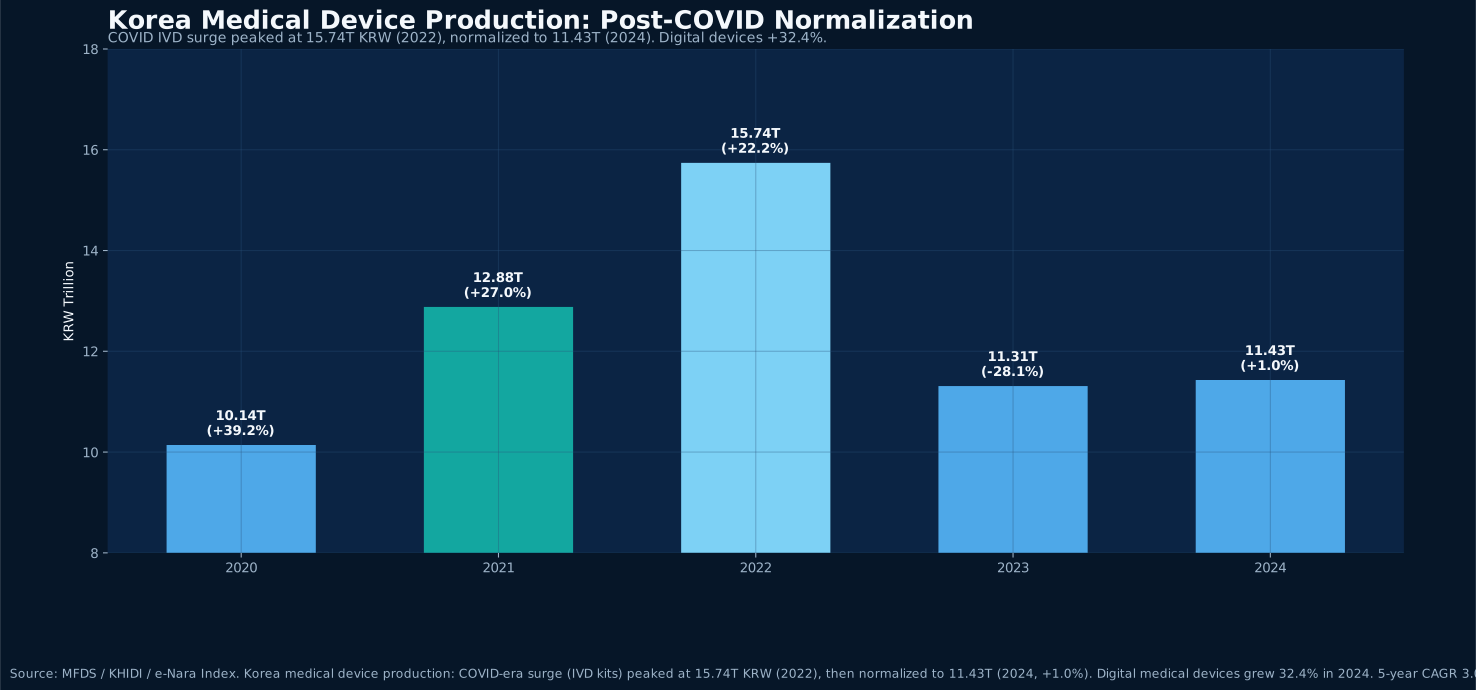
Korea's 2024 medical device production reached 11.43T KRW with exports at $5.26B. As COVID tailwinds fade, digital medical devices emerge as the new growth engine (+32.4%). China is Korea's #2 export market ($640M), led by implants and ultrasound.
Read Article
Steel Trade · 2026-04-08
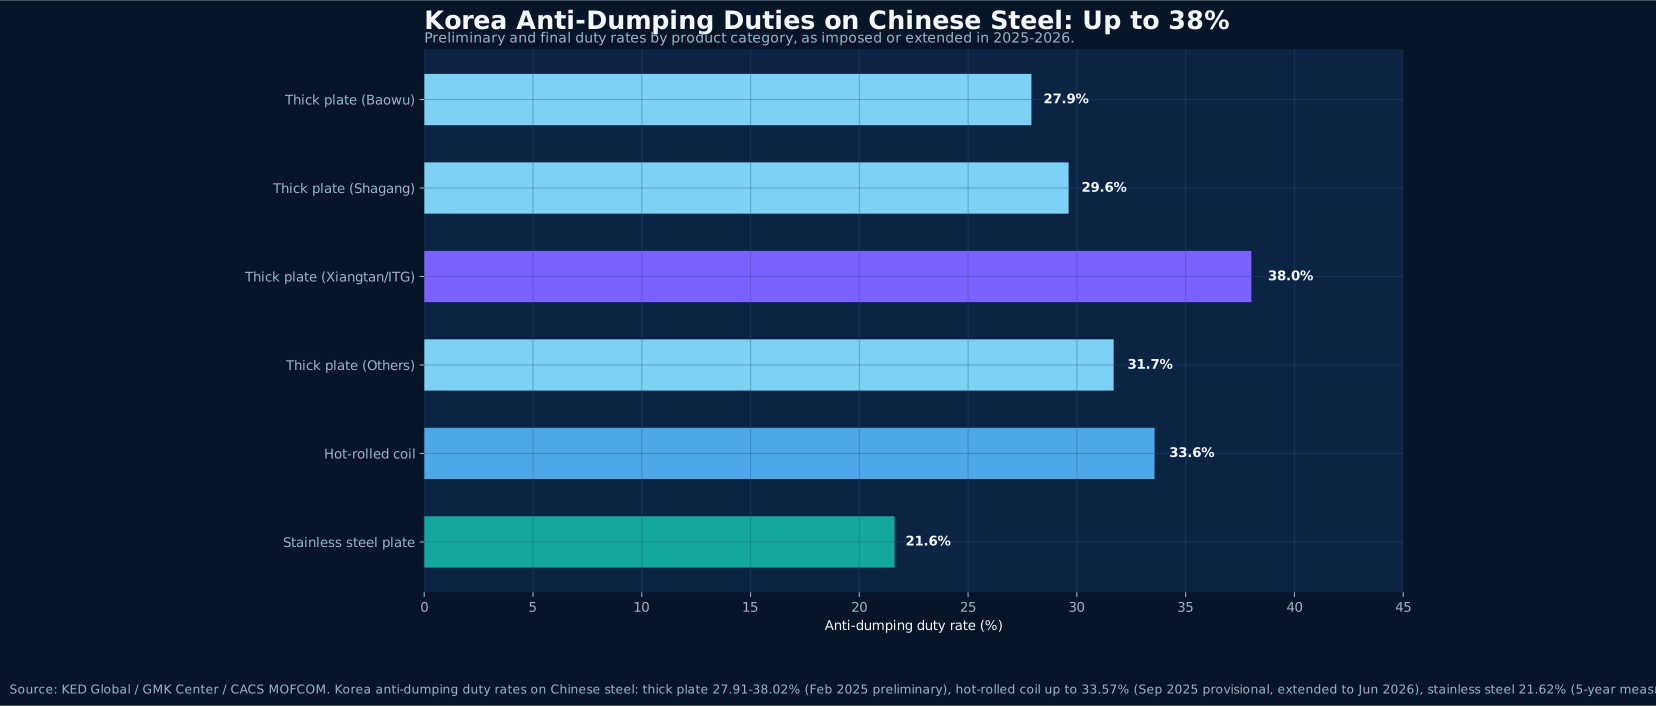
Between 2025 and 2026, Korea expanded anti-dumping measures on Chinese steel from heavy plate to hot-rolled coil and stainless steel, with duties up to 38.02%. Yet Chinese steel shipments to Korea keep rising — a paradox that reveals structural shifts.
Read Article
Beauty Regulation · 2026-04-08
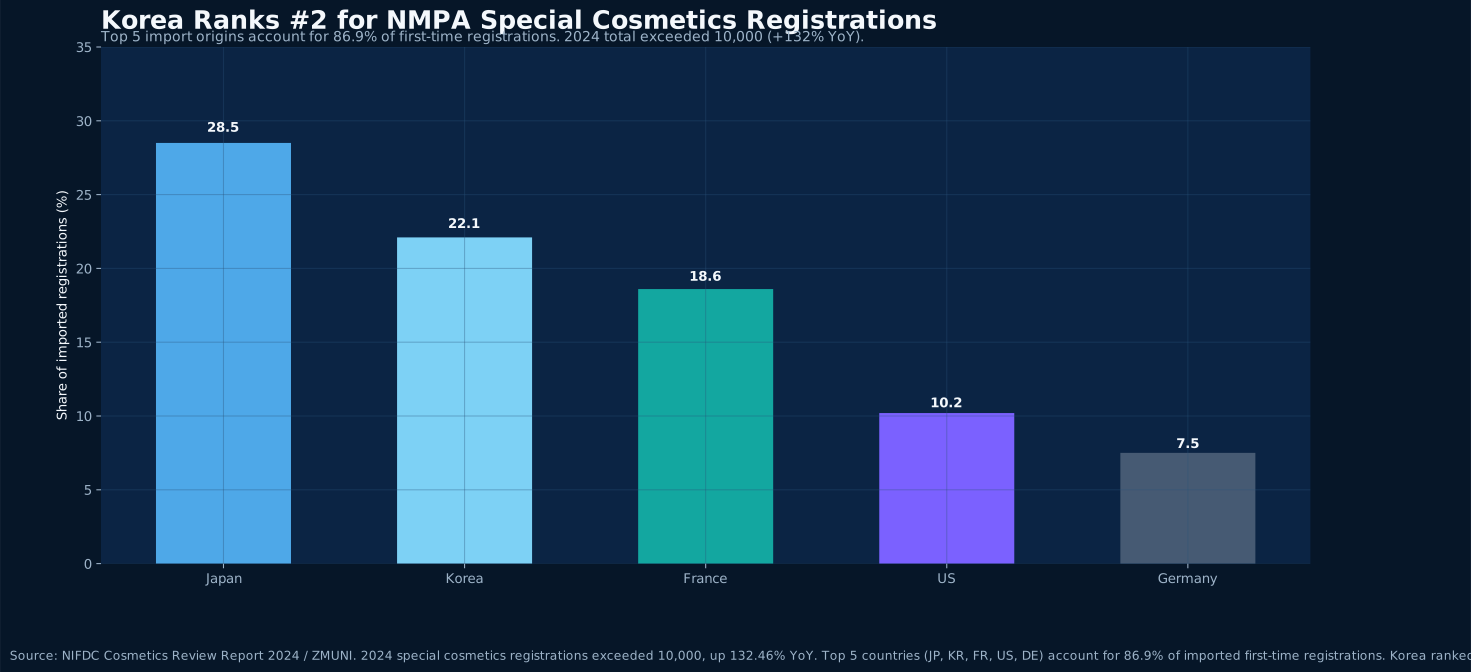
From February 2026, China launched a cosmetics e-labeling pilot in six major cities while NMPA continues to reform its registration system. Special cosmetics registrations exceeded 10,000 in 2024, up 132% YoY. Korea, as the second-largest import source, faces both opportunity and compliance complexity.
Read Article
Clean Energy Trade · 2026-04-08
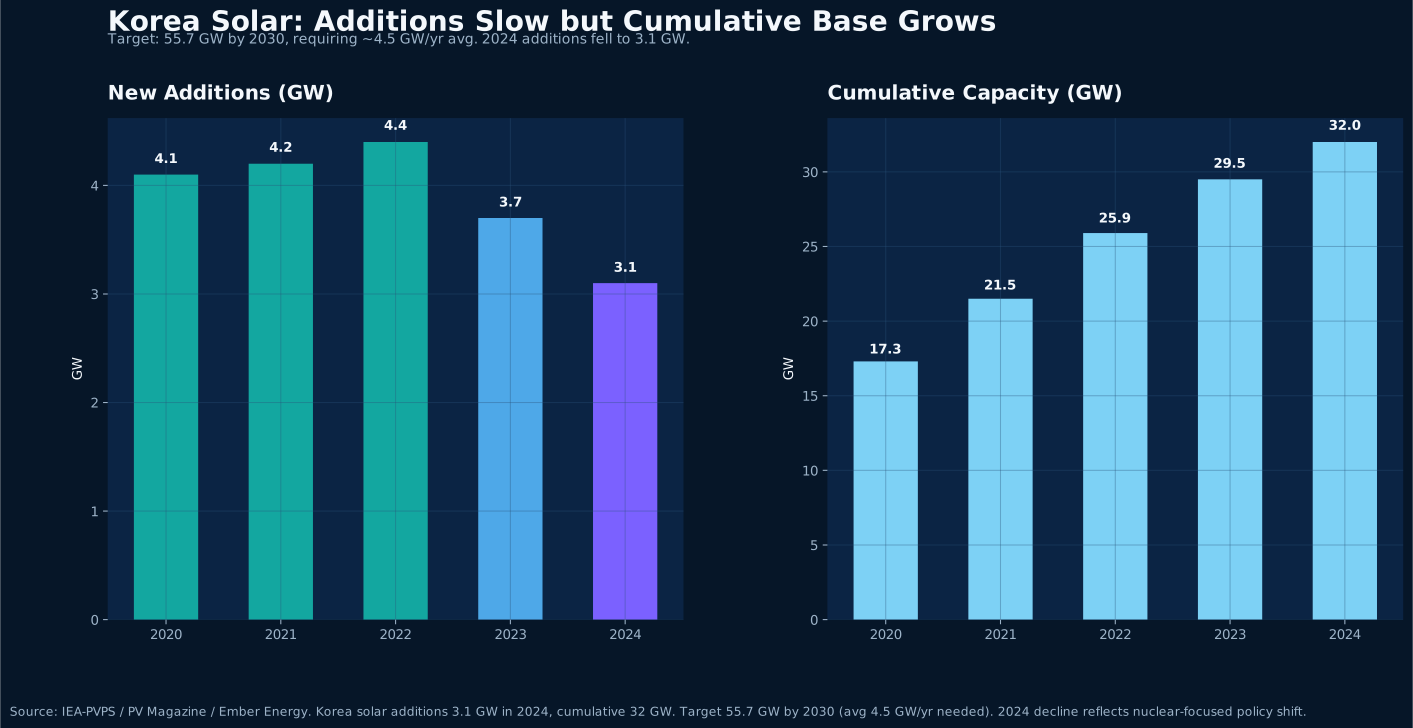
Korea’s cumulative solar capacity has reached 32 GW, but 2024 additions dropped to 3.1 GW, leaving a significant gap to the 2030 target of 55.7 GW. Meanwhile, China commands 93–98% of upstream PV supply. The tension between Korea’s clean energy goals and supply chain security is rising.
Read Article
Channel Insight · 2026-04-08
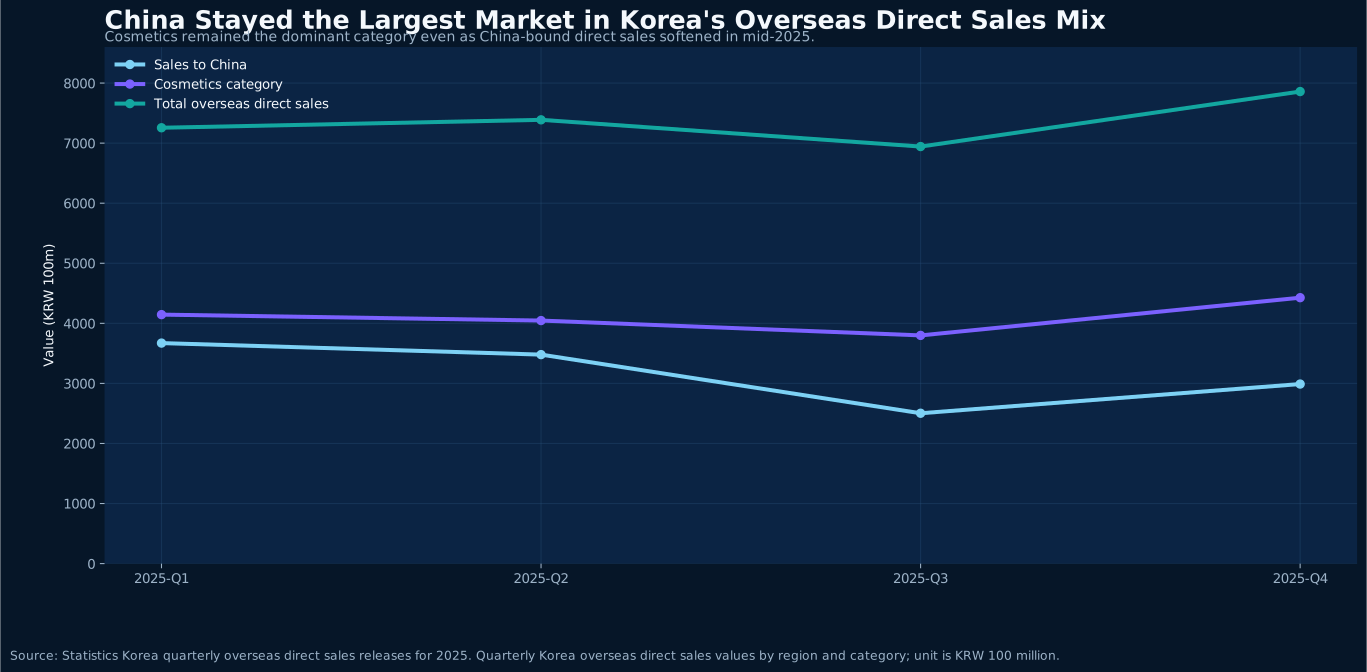
Statistics Korea shows Korea's overseas direct sales rose to KRW 785.9 billion in Q4 2025, yet sales to China fell to KRW 298.9 billion, clearly below the level seen earlier in the year. Cosmetics remained the largest category, but the real shift is that traffic and fulfillment are moving away from one-market dependence toward a lighter multi-market channel structure.
Read Article
Retail Insight · 2026-04-08
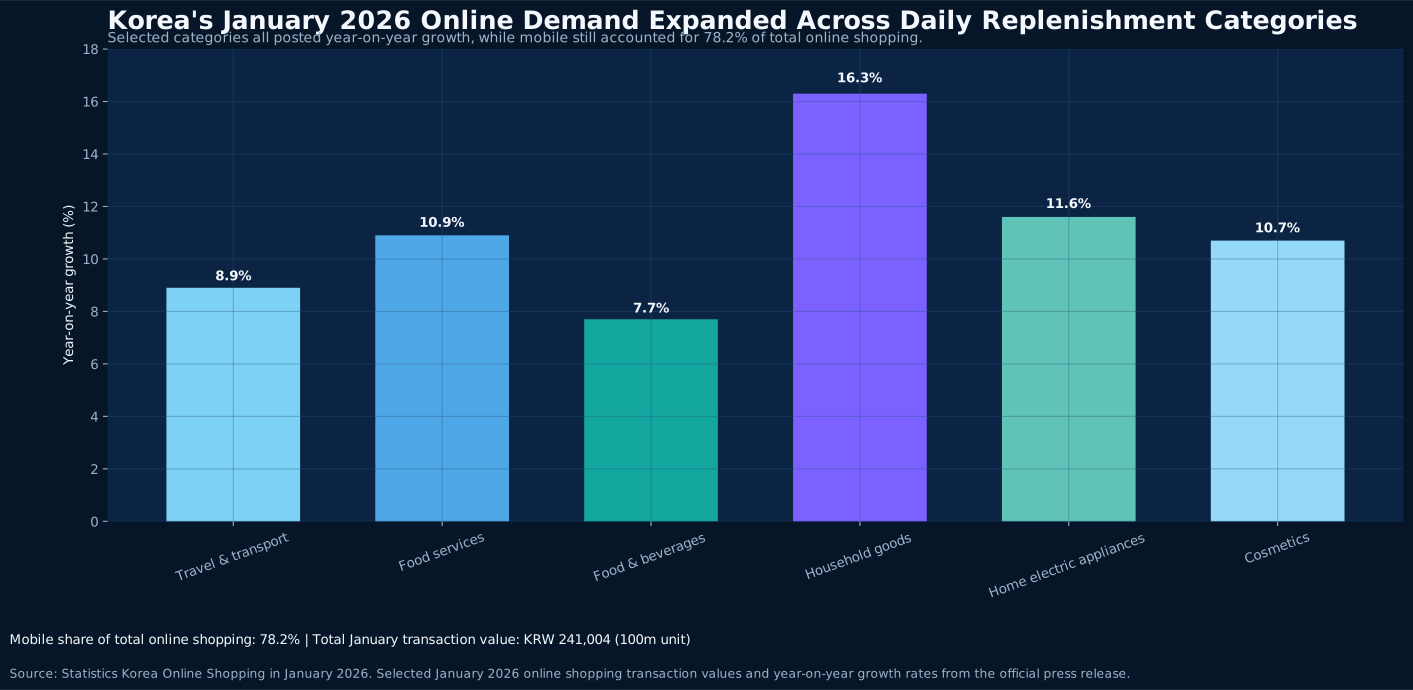
Statistics Korea's January 2026 online-shopping release shows household goods grew 16.3% year on year and home electric appliances rose 11.6%, both outpacing the broader market. Combined with KRW 200.1 billion in Q4 overseas direct purchases of home-and-auto goods, the signal is clear: Korean consumption is shifting from bulk promotion buying to higher-frequency, more fragmented home replenishment, pulling China's home-living supply chain back into the spotlight.
Read Article
Auto Insight · 2026-04-08
From its formal Korea entry in January 2025 to 6,107 units sold for the full year, BYD has already shown that Chinese EVs in Korea are no longer just a headline story. At the same time, KAMA's official 2026 outlook points to only low single-digit recovery for Korea's auto industry, meaning the next round of competition will extend far beyond vehicle pricing into parts, charging, repair, and service networks.
Read Article
Construction & Home · 2026-04-07
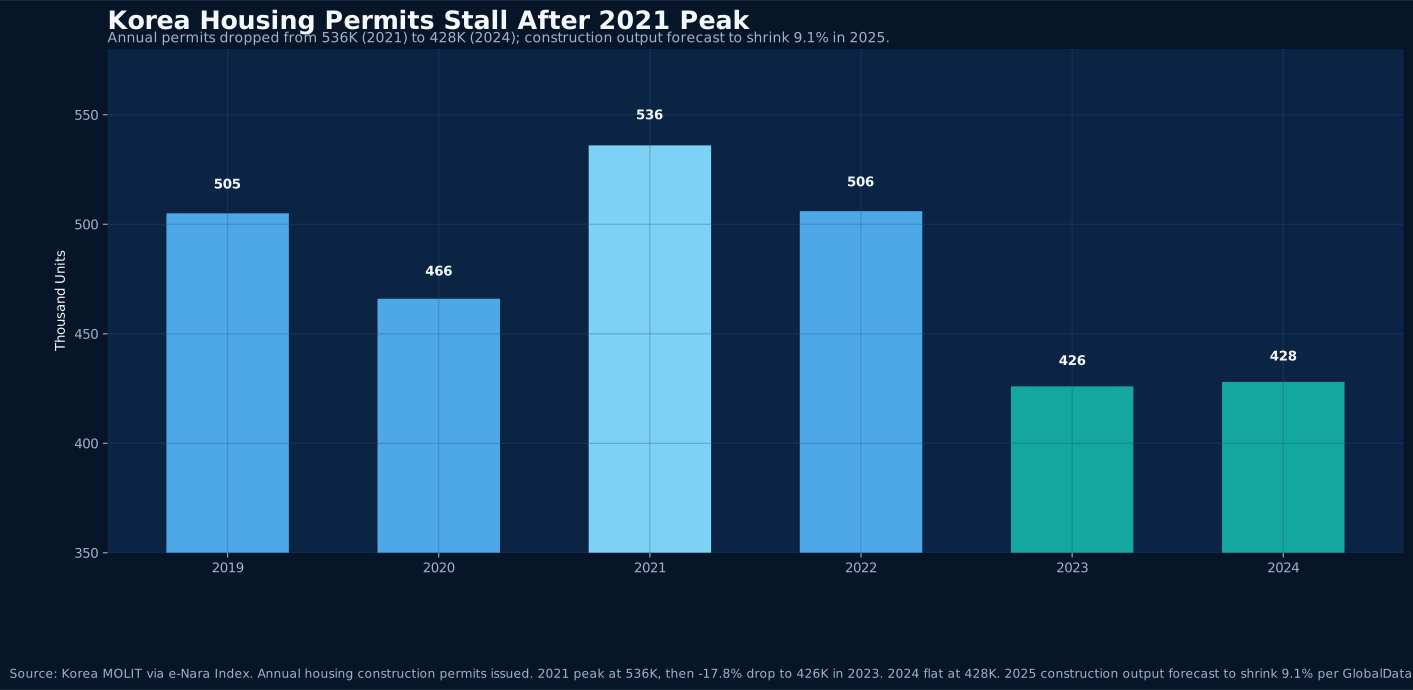
Korea issued only 428K housing permits in 2024, down 20% from the 2021 peak. Yet China retains 61% of the tile market and ranks as the #1 furniture supplier. We analyze China's structural competitiveness in Korea's shrinking construction cycle.
Read Article
Battery & EV · 2026-04-07
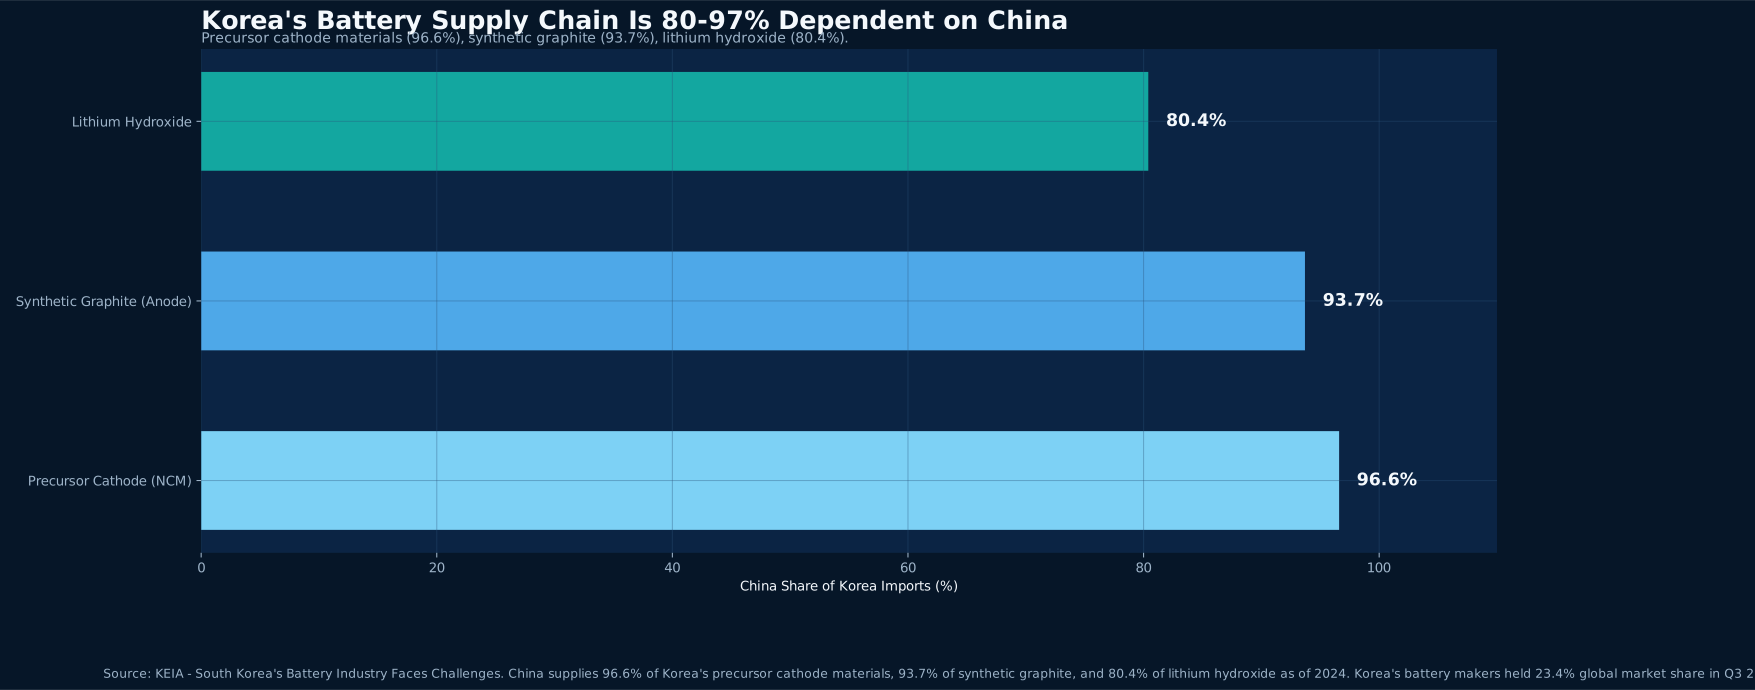
96.6% of Korea's precursor cathode materials, 93.7% of synthetic graphite, and 80.4% of lithium hydroxide come from China. Meanwhile, BYD sold 6,107 cars in its first year in Korea, with Zeekr and XPeng also entering. We analyze the China-Korea battery supply chain dynamics and EV market competition.
Read Article
Cosmetics & Functional Products · 2026-04-07
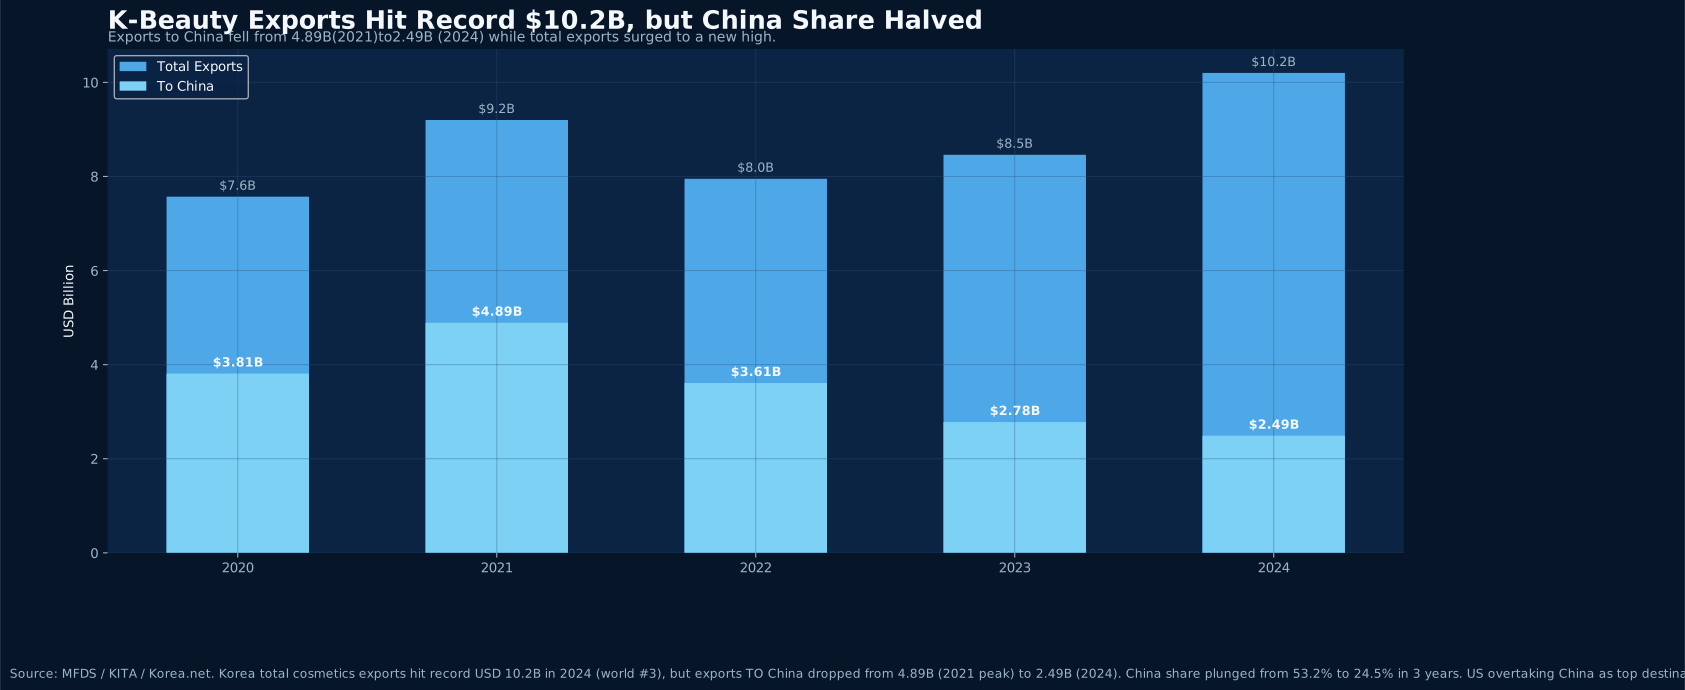
Korea's cosmetics exports hit a record USD 10.2B in 2024, but China-bound exports halved from $4.89B (2021) to $2.49B. Meanwhile, functional cosmetics production surged 35.2% to KRW 7.35 trillion. We analyze K-Beauty's market diversification logic and the functional upgrade trend.
Read Article
Cross-Border E-Commerce · 2026-04-07
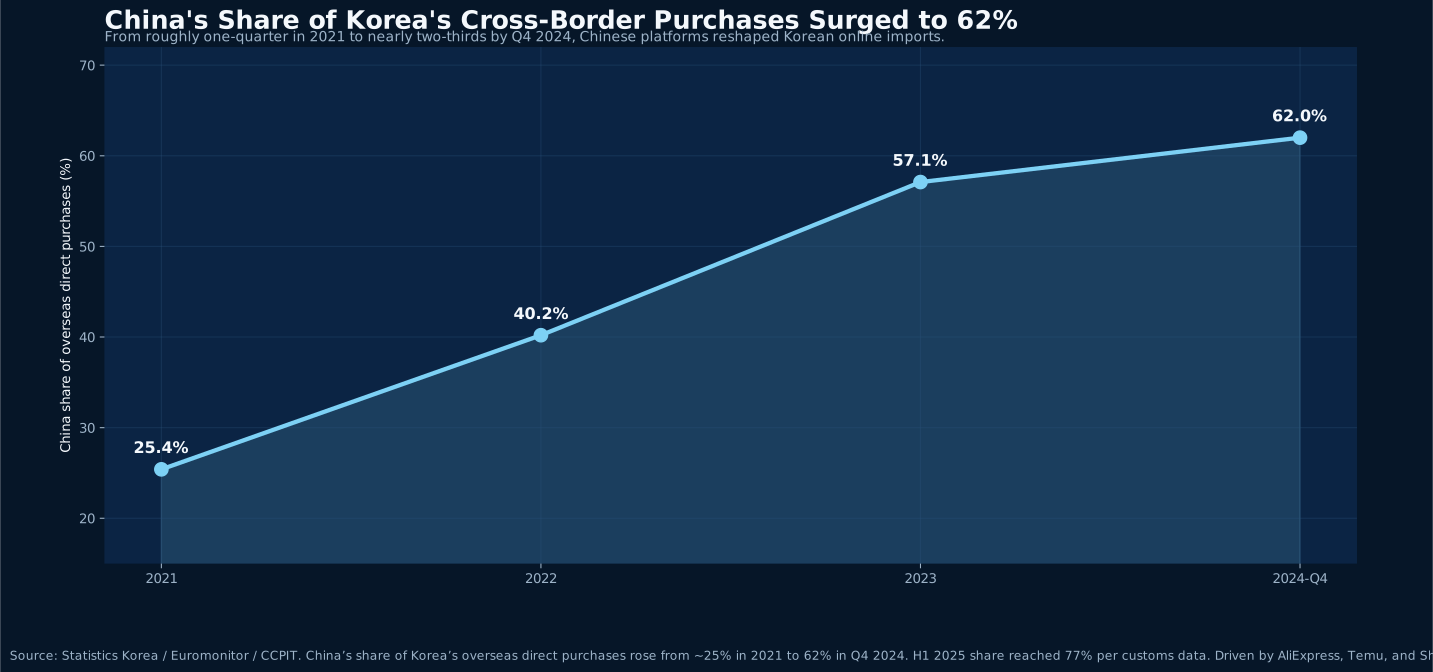
China’s share of Korea’s overseas direct purchases surged from 25% in 2021 to 62% in Q4 2024, reaching 77% in H1 2025. Temu’s global cross-border share jumped from 1% to 24% in three years, matching Amazon. We analyze the structural rise and its supply-chain implications.
Read Article
Critical Minerals & Supply Chain · 2026-04-07
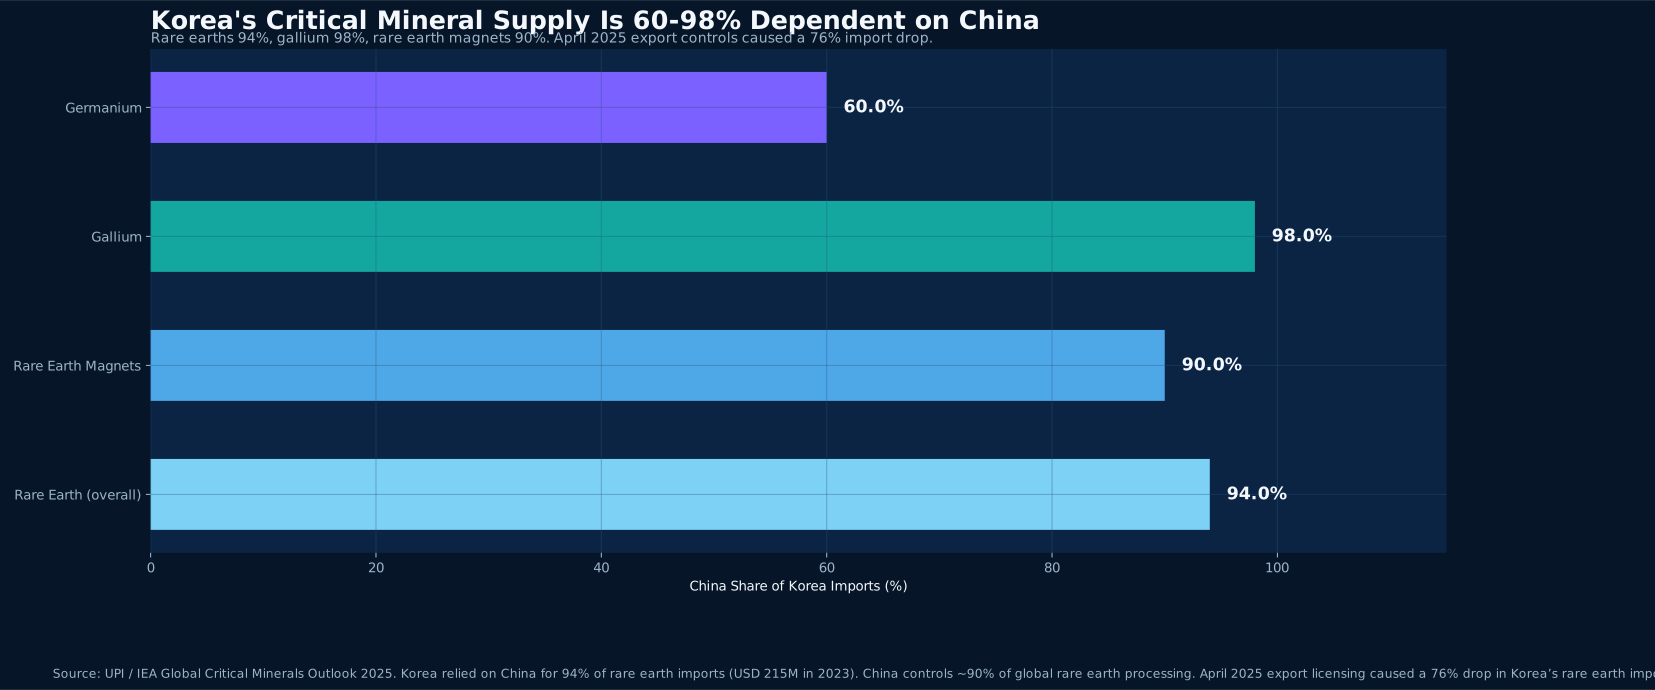
After China tightened rare earth export licensing in April 2025, Korea’s rare earth imports dropped 76%. Korea relies on China for 94% of its rare earths ($215M in 2023), while China controls 90% of global processing. We analyze the deep impact on Korean manufacturing, defense supply chains, and strategic responses.
Read Article
Pet Food & Consumer Goods · 2026-04-07
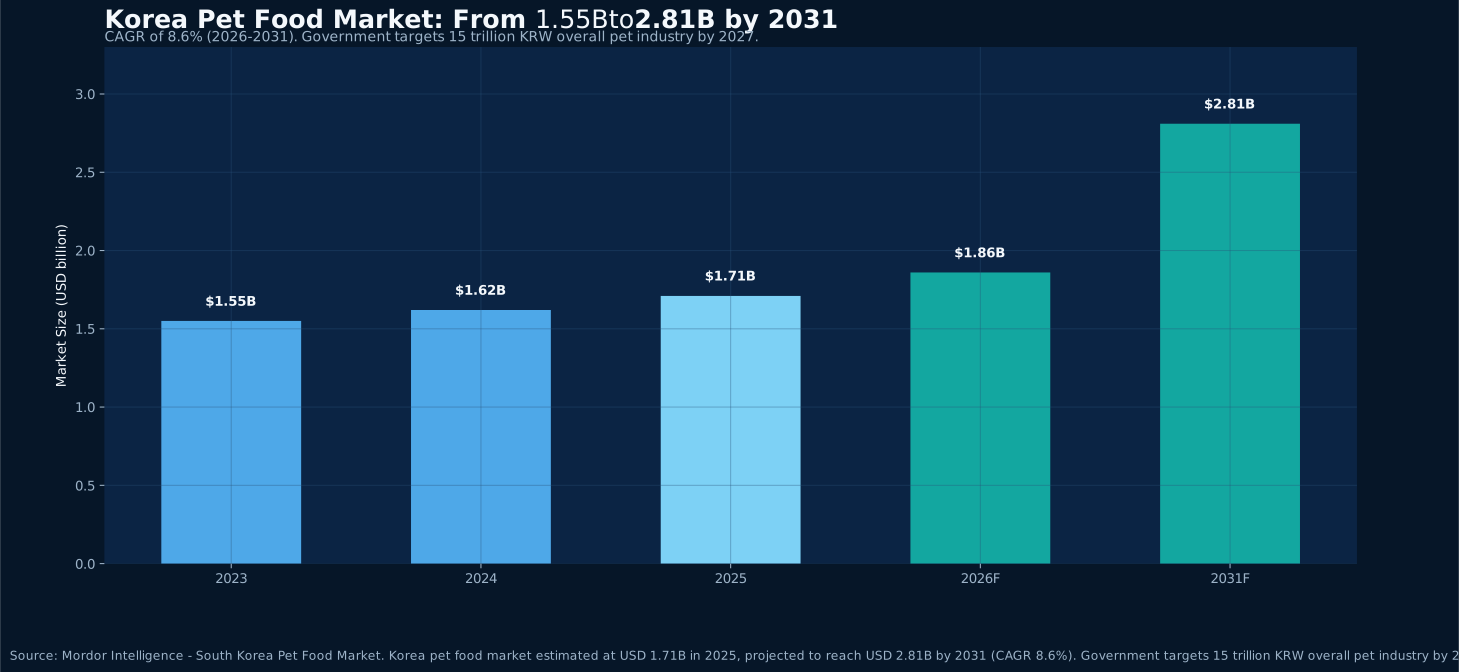
Korea’s pet food market reached $1.71B in 2025, projected to hit $2.81B by 2031 (CAGR 8.6%). China holds the No.1 supplier position with 32.57% import share, growing from $50K (2000) to $103M (2022). We analyze structural shifts in Korea’s pet market and opportunities for Chinese suppliers.
Read Article
Logistics Insight · 2026-04-06
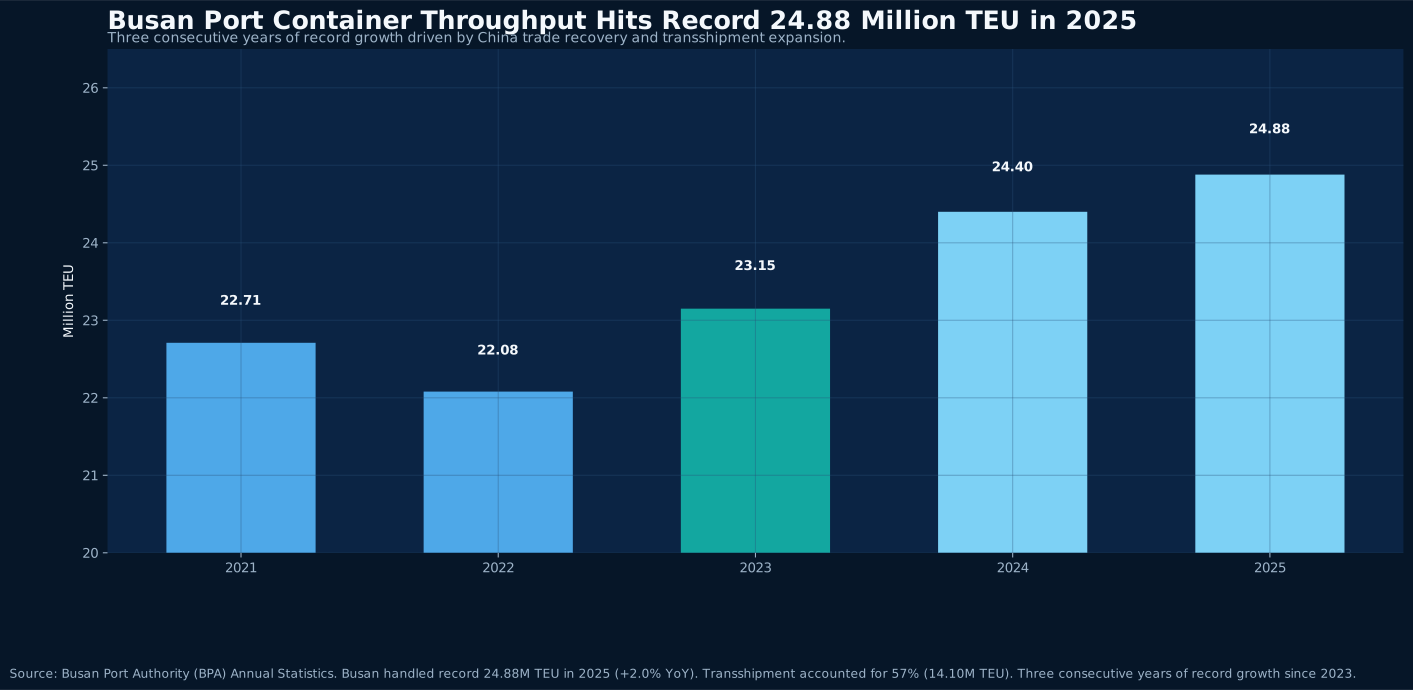
Busan Port handled 24.88 million TEU in 2025, setting a record for the third consecutive year. Yet behind this figure lies a deeper story of transshipment growth, freight rate normalization, and an e-commerce-driven logistics transformation.
Read Article
Certification & Compliance · 2026-04-06
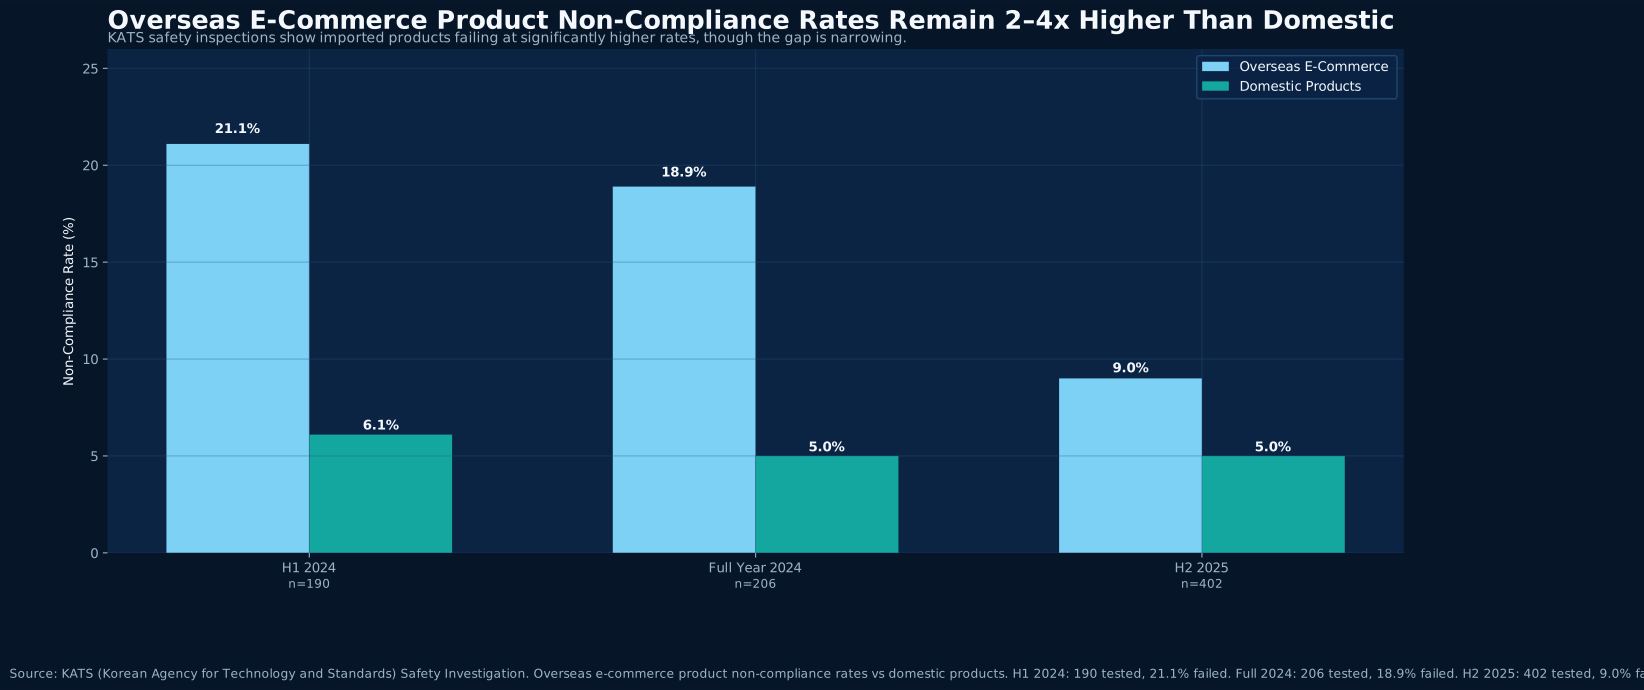
With overseas e-commerce product non-compliance rates 3-4x higher than domestic products and 2,537 total recalls in 2024, Korea is extending KC certification enforcement to online platforms. For Chinese exporters, this is both a challenge and an opportunity.
Read Article
Food & Agriculture · 2026-04-06
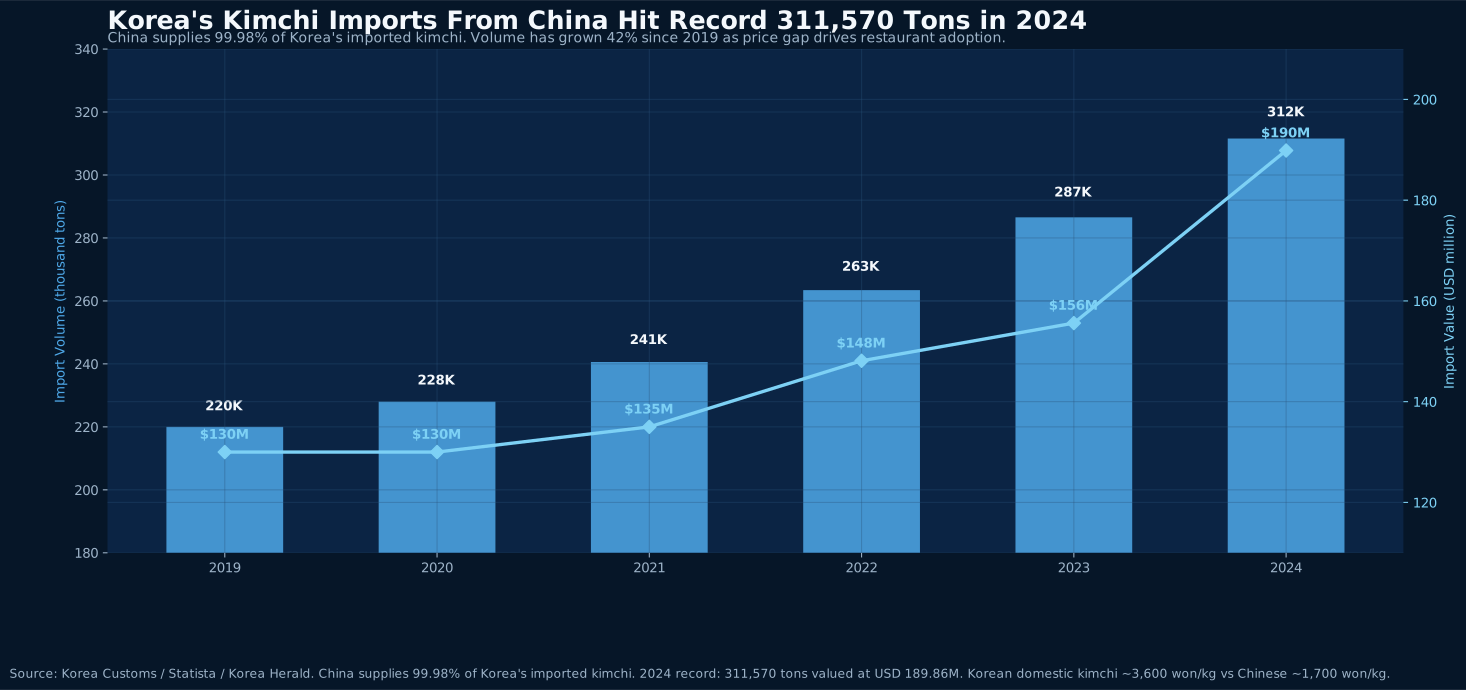
China supplies 99.98% of Korea's imported kimchi and ranks first in total food import volume. Yet 42.4% of 2024's 1,454 import food non-compliance cases involved Chinese products. Between a growing market and tightening regulations, understanding both structure and risk is essential.
Read Article
Trade Trend Insight · 2026-04-05
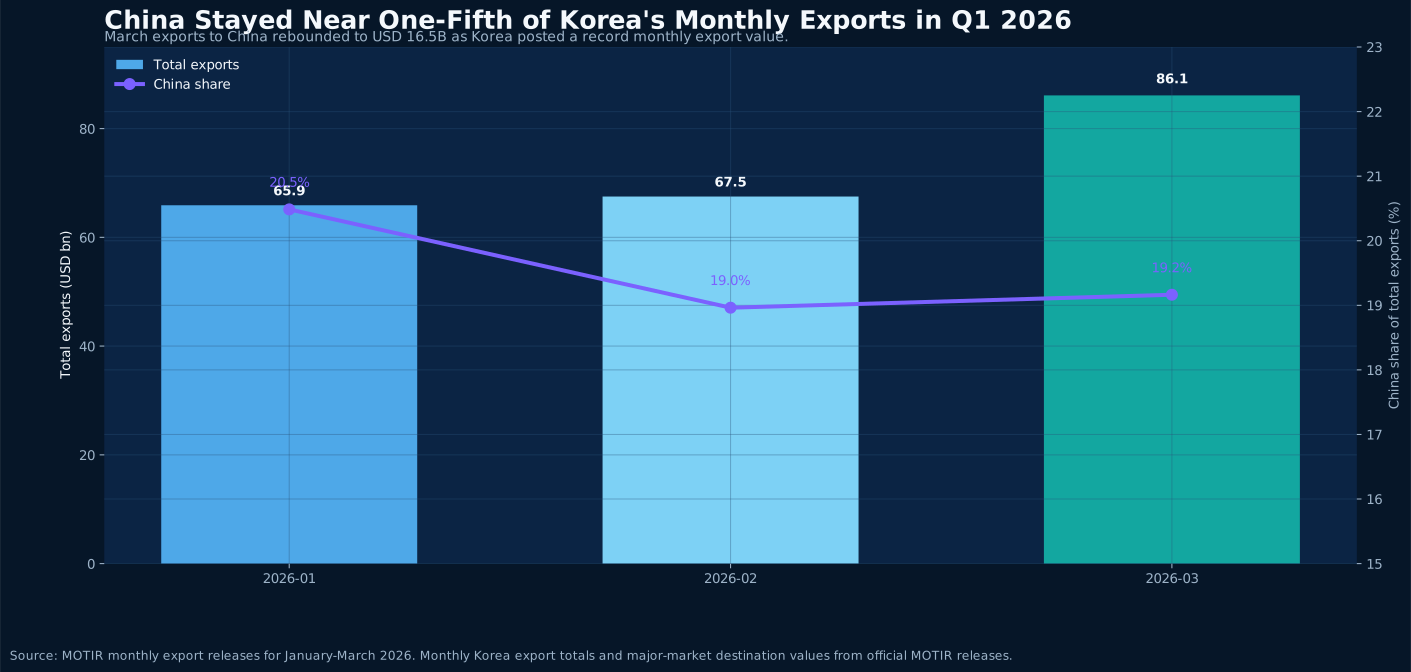
Official Korean export releases for January through March 2026 show exports to China moving from USD 13.5 billion in January and 12.8 billion in February to 16.5 billion in March. The bigger story is not the rebound alone, but the way semiconductors, computers, and consumer goods together put China back near the center of Korea's export structure.
Read Article
Cross-Border Ecommerce Insight · 2026-04-05
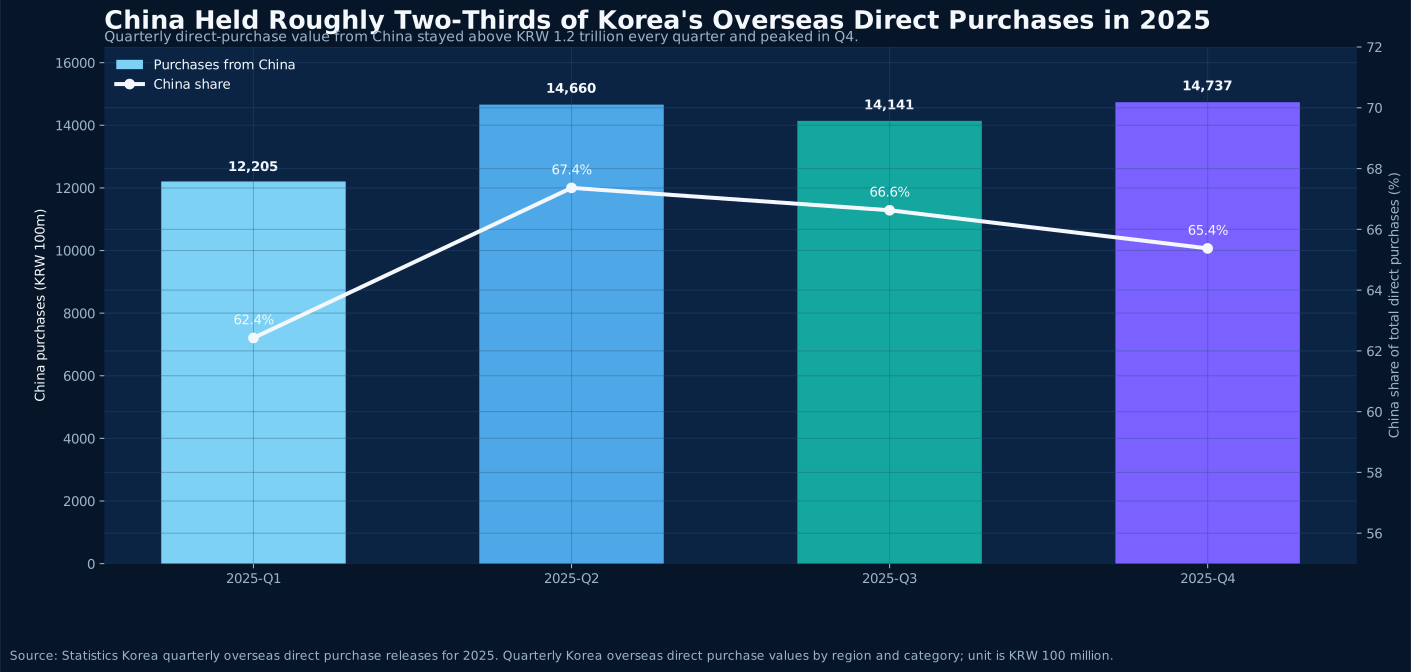
Across all four quarters of 2025, Statistics Korea shows China remaining Korea's largest source of overseas direct purchases, climbing from KRW 1.2205 trillion in Q1 to KRW 1.4737 trillion in Q4. The more important signal is the stability of China's supply position across fashion, food, and daily-use categories.
Read Article
Beauty Export Insight · 2026-04-05
Statistics Korea's 2025 overseas direct-sales data kept China in the No.1 position across all four quarters, while Korean authorities simultaneously rolled out ecommerce HS-code support and new K-beauty export initiatives. For packaging, filling, warehousing, and brand-service operators, the real shift is that channel speed and compliance are now moving forward together.
Read Article
Policy & Trade Insight · 2026-04-05
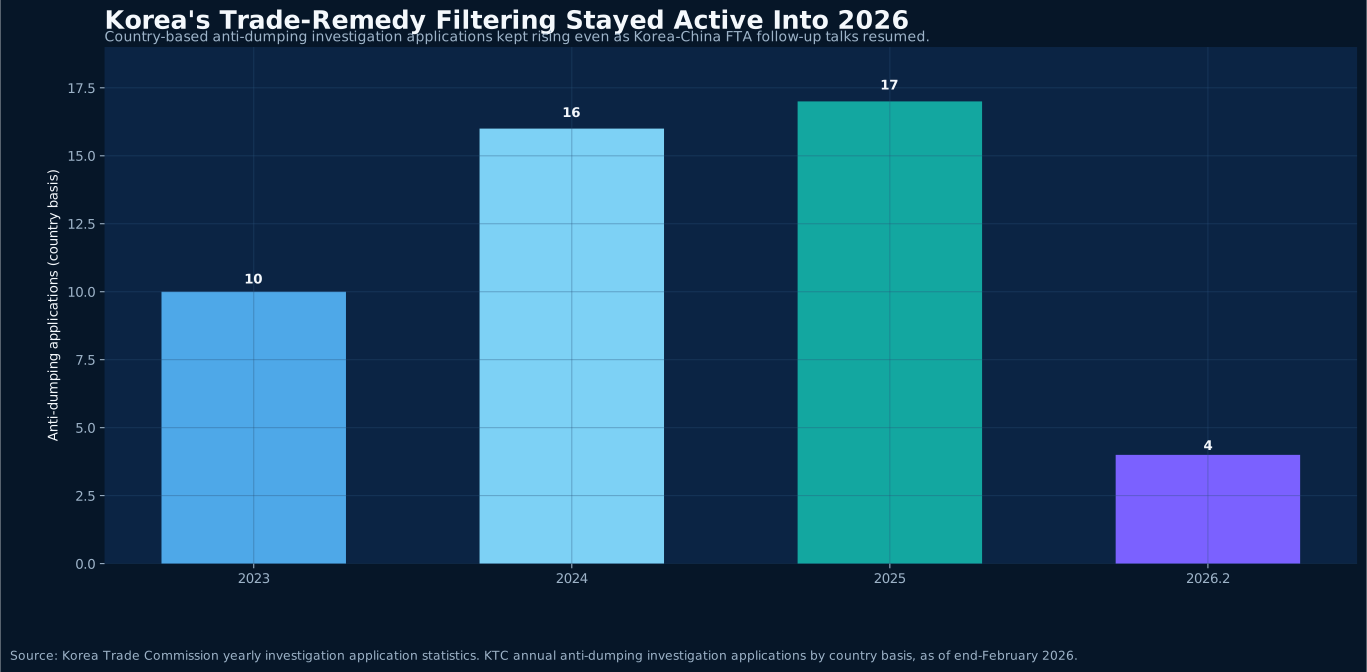
When firms hear that Korea and China are accelerating follow-up talks on FTA services and investment, they often assume the market is becoming easier again. The public signal from Korea says something more precise: institutional upgrading and dialogue are returning, while anti-dumping, circumvention control, and enforcement are moving further forward at the same time. The opportunity is not a looser market, but a clearer threshold for how business must be done.
Read Article
Exhibition & Channel Insight · 2026-04-05
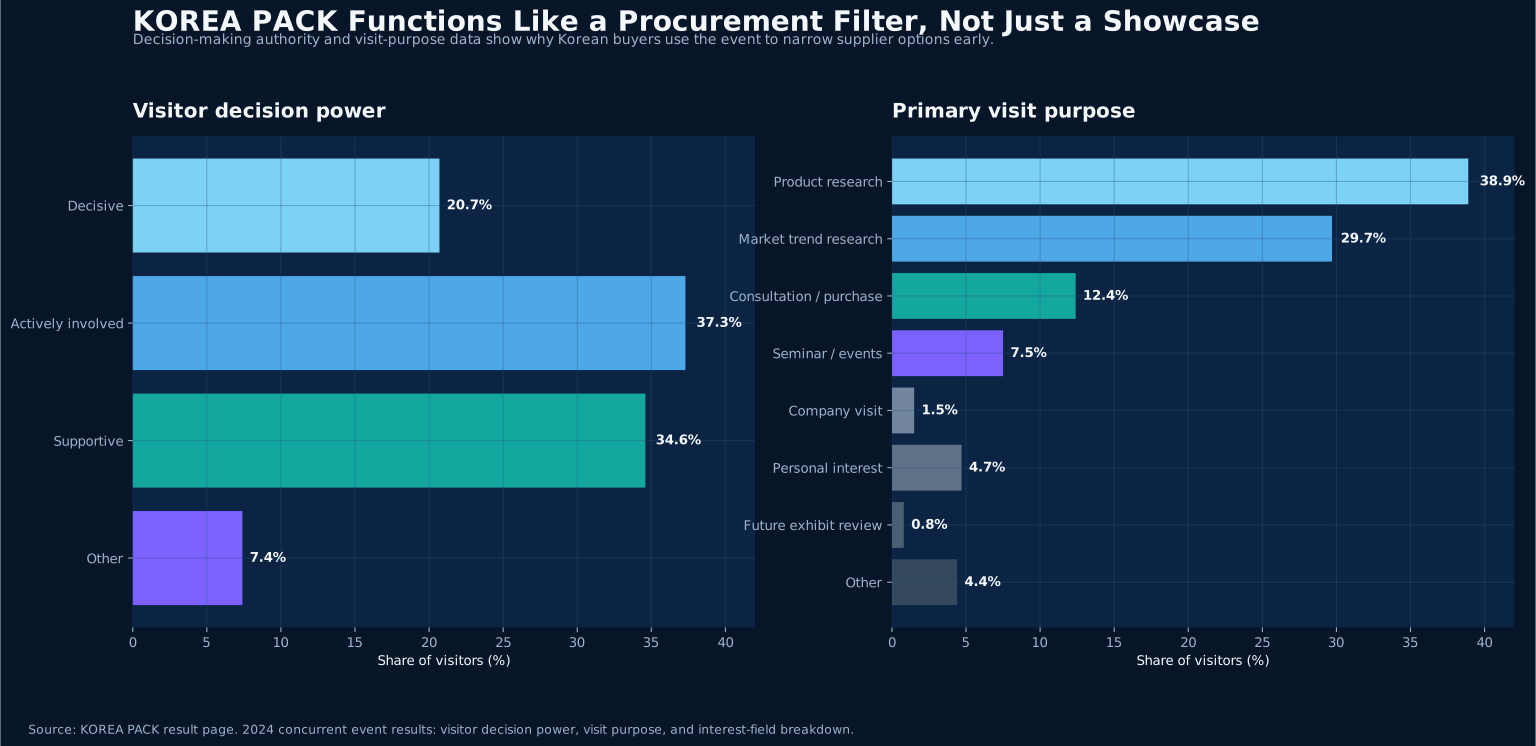
Many suppliers still treat major Korean packaging exhibitions as ordinary places to meet contacts, hand out brochures, and look at trends. The structure in KOREA PACK’s official results says something stronger. A combined 58.0% of visitors were decisive or actively involved in purchasing decisions, while 68.6% came primarily for product research or market-trend scanning. This makes the show less of a branding exercise and more of a concentrated window where Korean buyers screen the next round of supplier relationships.
Read Article
Retail & E-commerce Insight · 2026-04-05
The signal in Statistics Korea’s January 2026 online shopping release is not a single breakout category. It is the simultaneous expansion of multiple high-frequency daily-use and service categories. Travel, food service, beverages, household goods, appliances, and cosmetics all moved higher year on year, while mobile still accounted for 78.2% of transactions. That suggests Korean platform demand is leaning less on isolated campaign spikes and more on faster, fragmented, replenishment-driven consumption.
Read Article
Glass Insight · 2026-04-04
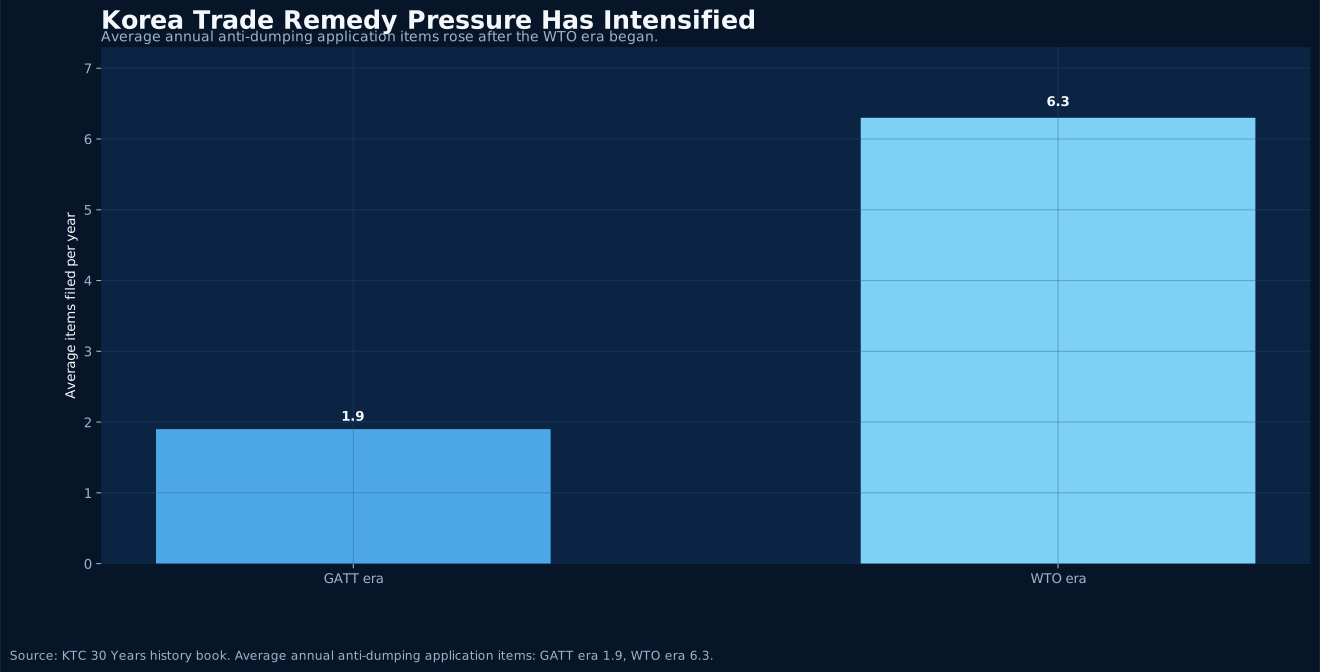
Trade pressure on standard float glass from China has not erased Korean demand. What is changing is the buying mix, with tempered, Low-E, insulated, and other processed categories becoming more important.
Read Article
Beauty Packaging Insight · 2026-04-04
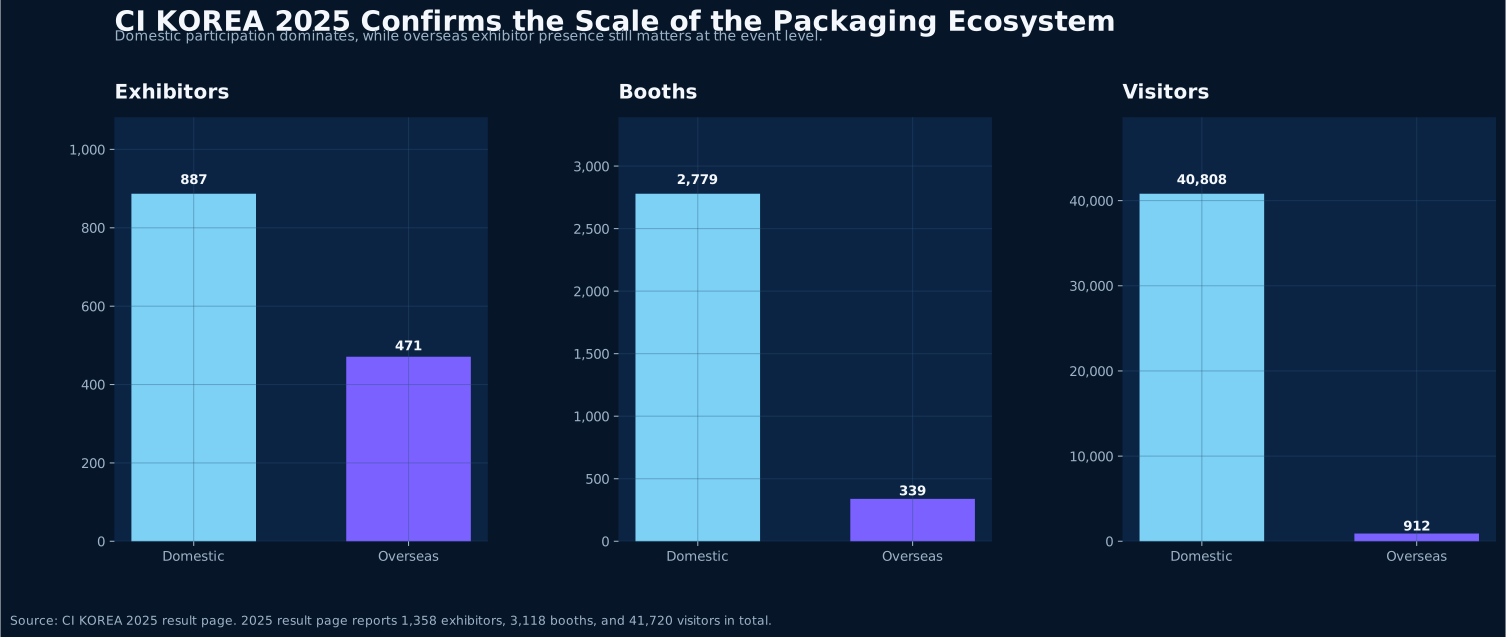
K-beauty opportunity no longer belongs only to large-batch standard packaging. As channels such as Olive Young and Musinsa expand, launch cycles accelerate, product mixes fragment, and packaging trials become more frequent, pushing suppliers from simple fulfillment toward launch coordination.
Read Article